EV/EBITDA: The Valuation Metric for High-Debt Companies

Imagine this situation. You want to compare two companies in the same business - say both operate hotel casinos in Asia. Company A is 100% equity-funded (zero debt). Company B is 60% debt-funded. Both generate roughly similar revenue and operating profit.
When you use PE (Price-to-Earnings) to compare them, the result is misleading: - Company A: net profit RM500 million, PE 15x - Company B: net profit RM200 million (due to high interest expense), PE 30x
By PE, Company B looks more expensive. But in reality both operate with the same efficiency. The PE has been destroyed by Company B's interest expense - not by business quality.
This is the classic PE problem for high-debt companies. For companies in this category - utilities, telco, casino, shipping, mega construction, REITs, banking - professional investors don't use PE as the primary metric. They use EV/EBITDA.
In this article, we unpack: - EV and EBITDA formulas in detail (you can calculate yourself) - Why EV/EBITDA is superior for high-debt companies - Practical examples from Bursa Malaysia: Tenaga (1295), Genting (3182), Genting Malaysia (4715) - EV/EBITDA benchmarks by sector - EV/EBITDA weaknesses - when it fails to give the real picture - How to use EV/EBITDA alongside other metrics for stronger decisions
Core Concepts: EV and EBITDA
Before diving into formulas, understand these two acronyms thoroughly.
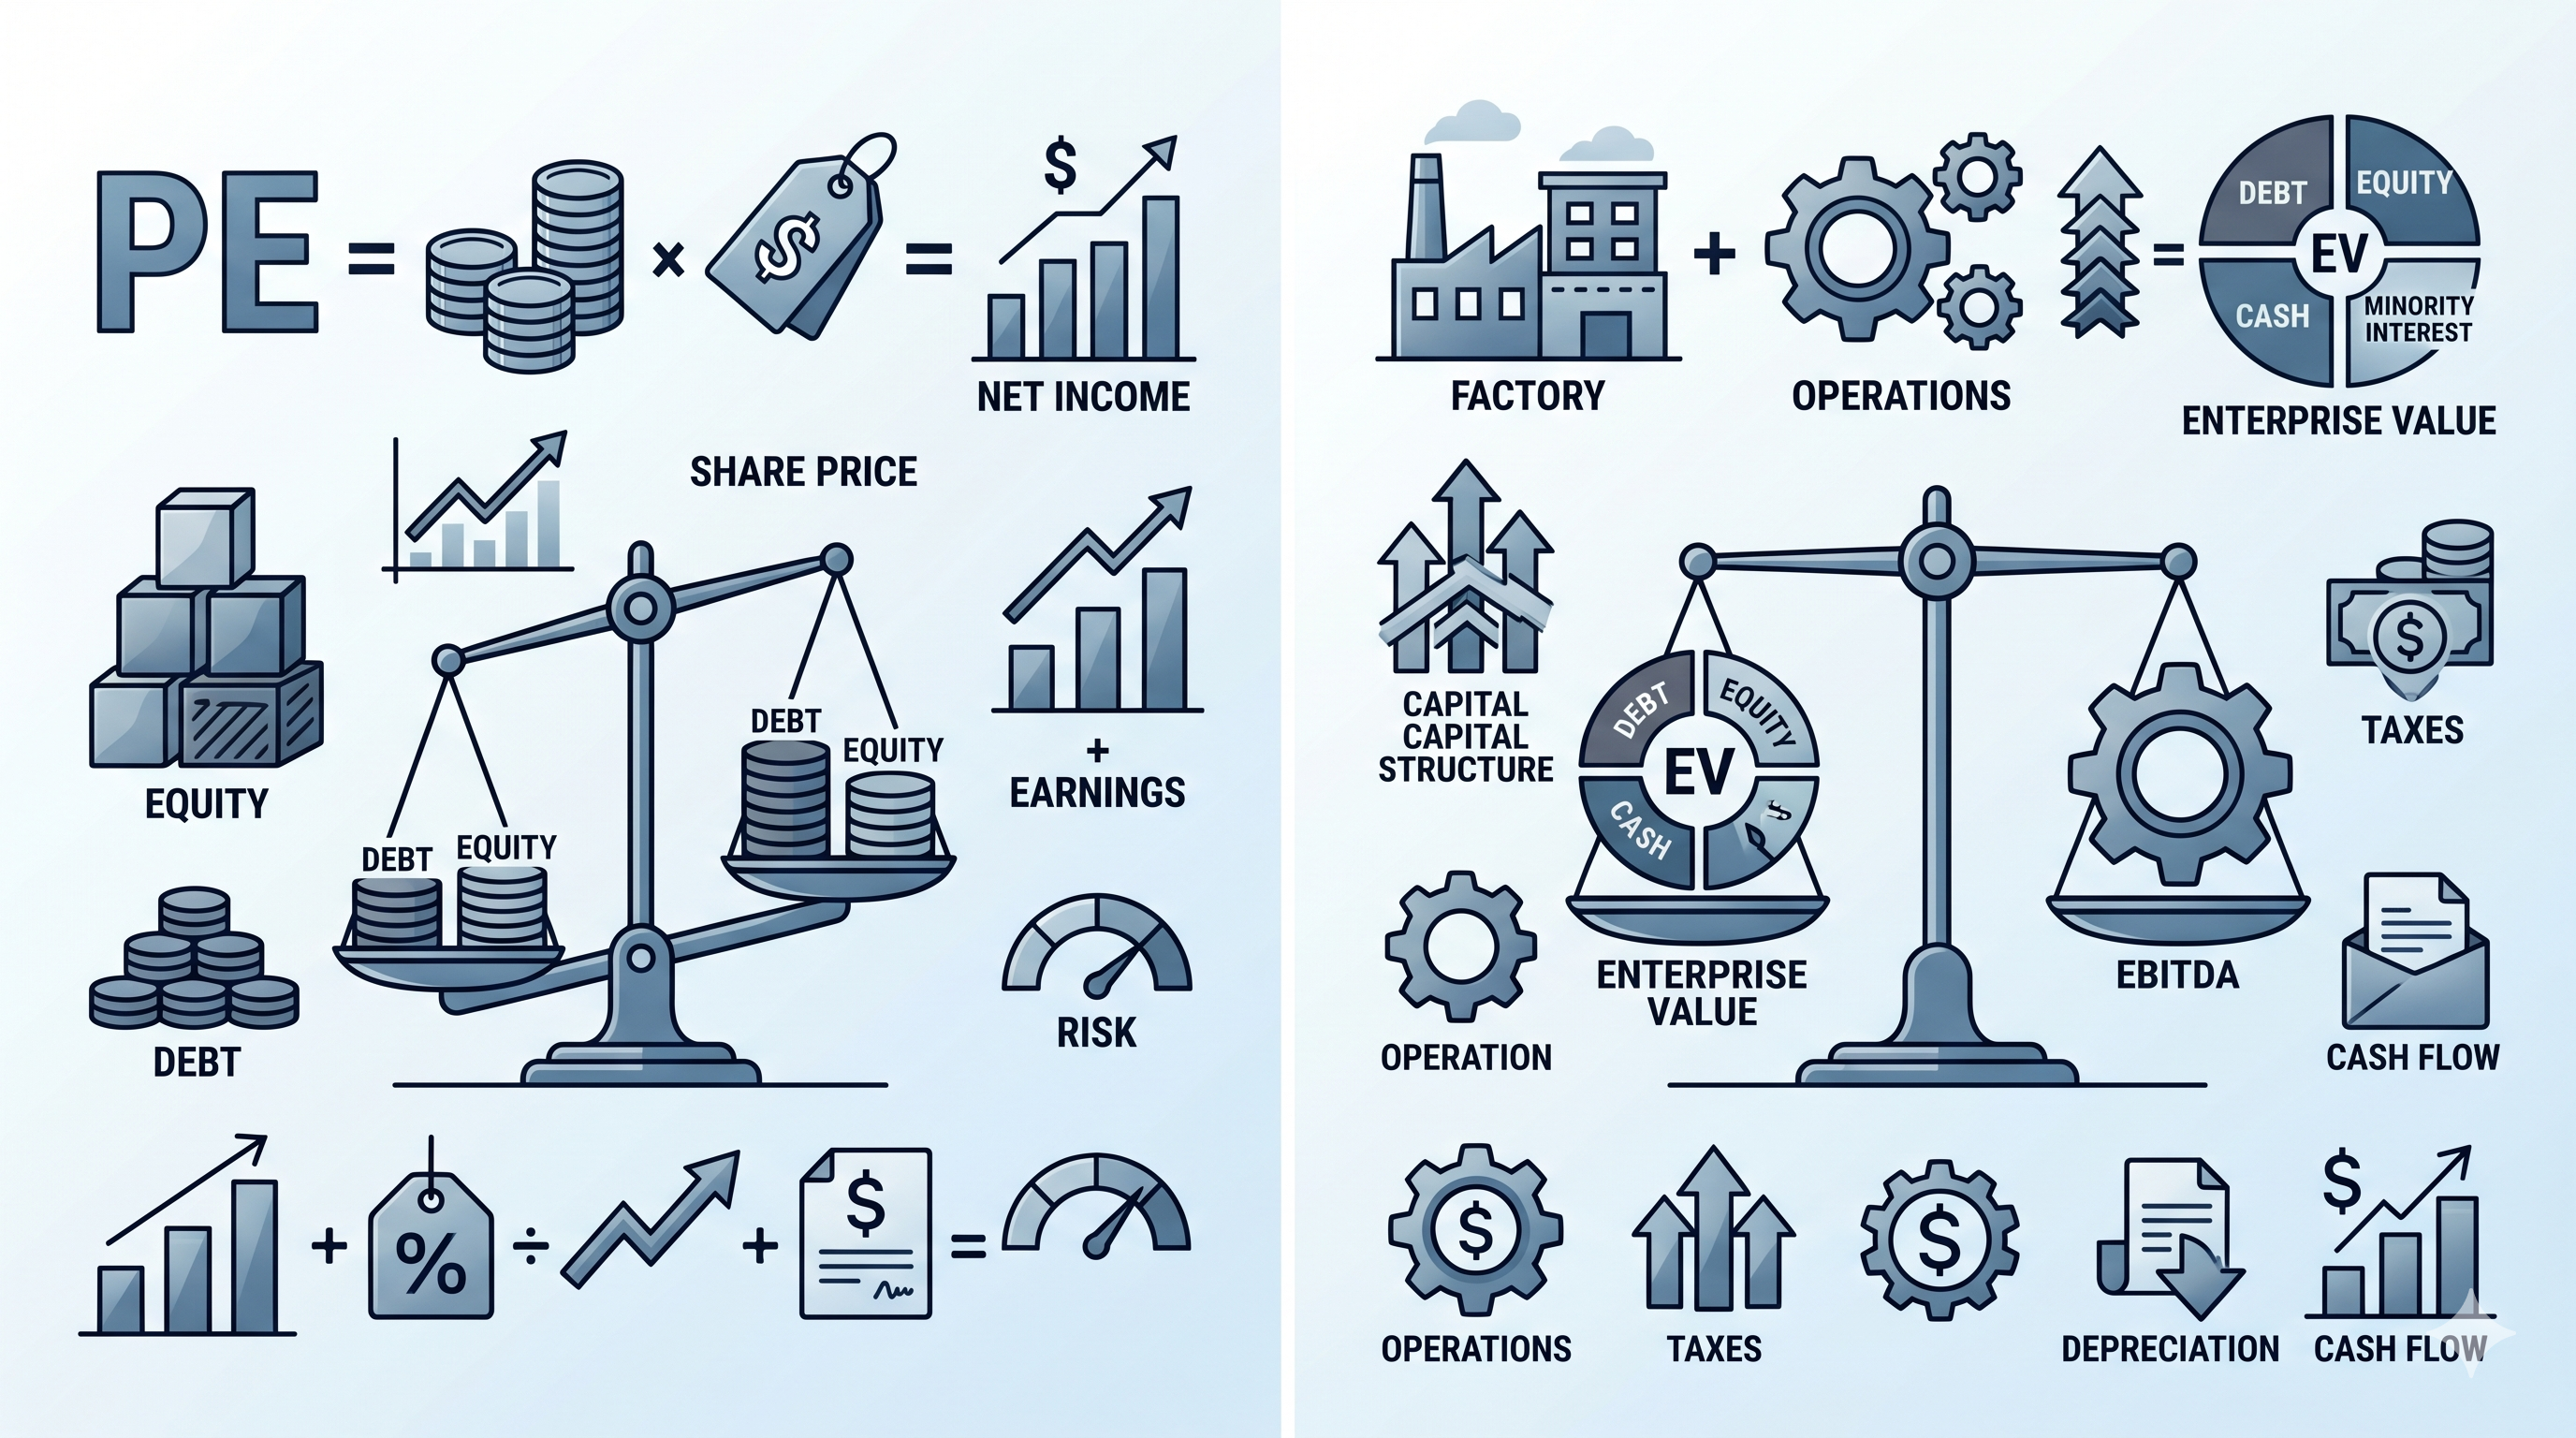
EV (Enterprise Value)
EV = the total value of the company, including all funding sources, not just the value owned by common shareholders.
Components: 1. Market Cap = share price × total shares outstanding 2. Total Debt = short-term + long-term borrowings + bonds + sukuk 3. Minority Interest = portion of subsidiaries not fully owned 4. Preferred Equity = preferred shares (rare in Malaysia) 5. Cash & Equivalents = cash and cash equivalents (SUBTRACTED because it "can be used to pay debt tomorrow")
Simple concept: EV is "how much you'd need to pay to buy the ENTIRE company" - regardless of who owns it. If you buy the whole company, you must: - Pay shareholders (market cap) - Take over the debt (debt) - Get back the existing cash (subtract cash)
EBITDA (Earnings Before Interest, Tax, Depreciation, Amortization)
EBITDA = pure operating earnings before financing costs, taxes, and non-cash costs.
Or top-down:
Or from EBIT:
Components: 1. Interest Expense added back - because it's financing cost, not operating cost 2. Tax added back - because it varies by country and structure 3. Depreciation & Amortization added back - because it's an accounting entry, not cash outflow
Simple concept: EBITDA is "how much cash this business generates before paying banks and government". It measures pure operating quality.
Why the EV/EBITDA Combination Matters
Both EV and EBITDA are agnostic to capital structure: - EV includes all funding sources (equity + debt) - EBITDA excludes financing costs (interest)
Result: two companies with the same operations but different capital structures will show the same EV/EBITDA - as they should.
The Complete EV/EBITDA Formula
Manual Calculation Example: Genting Malaysia (4715)
Let's calculate Genting Malaysia's EV/EBITDA using approximate figures:
Step 1: Calculate EV - Market Cap (RM2.35 × 5.6 billion shares): ~RM13.2 billion - Total Debt: ~RM10 billion - Cash: ~RM4 billion - Minority Interest: ~RM0.5 billion - EV = 13.2 + 10 + 0.5 - 4 = RM19.7 billion
Step 2: Calculate EBITDA (FY2024 estimate) - Revenue: ~RM10 billion - Operating costs (excluding D&A): ~RM7.8 billion - EBITDA = RM2.2 billion
Step 3: Calculate ratio - EV/EBITDA = 19.7 / 2.2 = ~9.0x
This aligns with The Edge's report on the Genting Malaysia takeover valued at 9.1x EV/EBITDA based on audited 2024 figures.
Why EV/EBITDA Is Superior for High-Debt Companies
Now let's unpack in detail why this metric is better than PE for leveraged companies.
1. Capital Structure Neutralization
Compare two hypothetical companies with identical operations:
| Item | Company A (0% debt) | Company B (60% debt) |
|---|---|---|
| Revenue | RM1,000 million | RM1,000 million |
| Operating profit (EBIT) | RM200 million | RM200 million |
| Interest expense | RM0 | RM80 million |
| Pre-tax profit | RM200 million | RM120 million |
| Tax (25%) | RM50 million | RM30 million |
| Net profit | RM150 million | RM90 million |
| Market cap | RM3,000 million | RM1,200 million |
| Total debt | RM0 | RM1,800 million |
| PE | 20x | 13.3x |
| EV/EBITDA (assume D&A = RM50 million) | 3,000 / 250 = 12x | (1,200+1,800) / 250 = 12x |
Critical insight: - PE is misleading: Company B looks "cheaper" at 13.3x vs 20x - EV/EBITDA is accurate: both at 12x - same operations valued the same
This is why professional investors prefer EV/EBITDA for cross-company comparison when capital structures differ.
2. Avoid D&A Distortion
D&A (Depreciation & Amortization) is an accounting entry, not a cash outflow. Companies with high capex (utility, telco, manufacturing) have large D&A that reduces net profit, even though cash generation remains strong.
Tenaga (1295) for example - has ~RM6-7 billion in D&A annually. Compared to PE, Tenaga looks "expensive" at 12-15x PE. But EV/EBITDA might only be 6-8x - more reflective of underlying cash generation.
3. Standard for M&A and LBO
In acquisition deals and leveraged buyouts (LBO), EV/EBITDA is the market standard: - Sector M&A multiples are quoted as "10x EBITDA", "12x EBITDA" - not PE - Private equity firms value targets using EV/EBITDA as primary metric - Bond/credit analysts use EV/EBITDA for leverage assessment
4. Works for Loss-Making Companies
Companies that are loss-making (negative net profit) - PE isn't applicable (negative or infinite). But if EBITDA is still positive, EV/EBITDA can be calculated. Suitable for: - Growth-phase companies with aggressive capex - Companies in restructuring or turnaround - Capex-heavy sectors like aviation (AirAsia X), early-stage property developers
Bursa Malaysia Examples: Which Are the High-Debt Companies?
According to The Edge Malaysia, aggregate net debt-to-EBITDA for FBM KLCI constituents rose 149% to 1.37x from 0.55x five years ago. This shows a significant rise in leverage among Bursa's largest names.
A few real examples:
Tenaga Nasional Berhad (TENAGA, 5347)
- Net debt: ~RM26-30 billion (among the highest on Bursa)
- Reason: capex for power generation, transmission, renewable energy
- PE unsuitable: high D&A (~RM6-7 billion annually) distorts earnings
- EV/EBITDA: ~6-9x (more reflective of operations)
- Lesson: When comparing TENAGA with other utilities (e.g., YTLPOWR), EV/EBITDA is more meaningful
Genting Berhad (GENTING, 3182) & Genting Malaysia (GENM, 4715)
According to CreditSights via The Edge: - Genting gross leverage: 5.9x (above Moody's 4x trigger) - EBITDA net leverage: >5x (above Fitch's 3.5x threshold) - Debt-to-EBITDA: >4.2x (acceptable level <3x, healthy <2x) - Recent valuation: 9.1x EV/EBITDA for the RM2.35 Genting Malaysia takeover offer
Casino businesses are inherently leveraged - integrated resorts require billions in capex. PE can't capture their true value.
AirAsia X (5238)
- Highly leveraged - aircraft financed through sale-and-leaseback
- Post-COVID: equity nearly negative, PE not applicable
- EV/EBITDA more suitable for valuation - operating EBITDA positive despite net loss
Mega Builders (e.g., IJM 3336, Gamuda 5398)
- MRT3, highway, etc. project debt amounting to billions
- Long working capital cycle
- EV/EBITDA directly captures debt impact
Sectors Commonly High-Debt on Bursa:
- Utilities (TENAGA, YTLPOWR, MMC)
- Telco (CDB Bhd, MAXIS, AXIATA)
- Casino/Leisure (GENTING, GENM)
- Mega construction (IJM, GAMUDA, WCT)
- Aviation (AAX, formerly MAS)
- High-gearing properties (some developers)
- Banks (DO NOT use EV/EBITDA - use Price/Book + ROE instead)
EV/EBITDA Benchmarks by Sector (Approximate)
There's no universal "rule of thumb" - depends on cycle, growth profile, and sector.
| Sector | EV/EBITDA Range | Comment |
|---|---|---|
| Utility (mature) | 6 - 10x | Tenaga, Petronas Gas, YTL Power |
| Telco | 4 - 8x | CDB, Maxis, Axiata - in terms of leverage |
| Bank | N/A | Use Price/Book + ROE instead |
| REITs | N/A | Use Price/AFFO or Dividend Yield |
| Casino/Leisure | 7 - 12x | Genting, Genting Malaysia |
| Consumer Staples | 12 - 25x | Nestle, F&N (low debt, premium quality) |
| Tech/SaaS US | 15 - 50x | NVIDIA, AAPL - high growth, low debt |
| Construction/Infrastructure | 6 - 10x | IJM, Gamuda - project-based |
| Mature manufacturing | 6 - 12x | Industrial, plantation companies |
| Plantation cycle | 5 - 15x | Cyclical - low at CPO peak, high at trough |
General rule of thumb: <8x = relatively cheap, 8-12x = fair, >12x = expensive unless growth supports it.
EV/EBITDA Weaknesses - When It Can Mislead
EV/EBITDA isn't a magic bullet. Several critical weaknesses:
1. EBITDA "Ignores" Capex - But Capex Isn't Optional for Some Sectors
For utility, telco, heavy manufacturing - capex is mandatory to sustain operations. High EBITDA but capex eating up all cash flow means shareholders end up with little.
Charlie Munger once commented sharply:
"I think that, every time you see the word EBITDA, you should substitute the words 'bullshit earnings.'"
Context: Munger opposes EBITDA as a proxy for free cash flow. For capex-heavy companies, Free Cash Flow (FCF) = EBITDA - Capex - Working Capital change is more accurate.
2. Doesn't Capture Working Capital Cycle
Companies with long working capital cycles (e.g., construction, manufacturing with capital tied up in inventory and receivables) produce high EBITDA on paper but low cash flow.
3. Ignores Cost of Debt
EV/EBITDA doesn't account for the actual cost to service that debt. A company with RM10 billion debt at 8% interest pays RM800 million annually - real cash outflow that doesn't appear in EBITDA but reduces shareholder returns.
4. EBITDA Can Be "Managed" by Management
In annual reports, companies can manipulate EBITDA definition with terms like: - "Adjusted EBITDA" - "EBITDA before non-recurring items" - "Underlying EBITDA"
Investors must scrutinize add-back items - some management adjust away legitimate operating costs to inflate EBITDA.
5. Not Applicable to Banks and REITs
- Banks: revenue and profit driven by net interest income - interest is NOT a cost that should be removed. Use Price/Book + ROE.
- REITs: D&A on properties isn't just accounting fiction - properties physically depreciate. Use Price/AFFO, Distribution Yield.
How to Use EV/EBITDA Smartly
For Bursa Malaysia retail investors, here's a practical approach:
Step 1: Which Sectors Should Use EV/EBITDA?
Use EV/EBITDA for: - ✅ Utility (TENAGA, PETGAS, YTLPOWR) - ✅ Telco (CDB, MAXIS, AXIATA) - ✅ Capital-intensive manufacturing - ✅ Casino/leisure (GENTING) - ✅ Construction/infrastructure - ✅ Cross-sector M&A analysis
Don't use for: - ❌ Banks (Public Bank, Maybank, RHB) - use P/B + ROE - ❌ REITs (Sunway REIT, IGB REIT) - use Price/AFFO + Yield - ❌ Insurance (Allianz, Tune Protect) - use P/B + Embedded Value - ❌ Junior miners or early-stage tech with negative EBITDA
Step 2: Compare EV/EBITDA with Sector Peers
Pull EV/EBITDA for the target company and 3-5 sector peers. Calculate median as the benchmark.
Example: Compare TENAGA with other utilities (YTLPOWR, MMC, Cypark) for the utility sector benchmark.
Step 3: Cross-Check with Other Metrics
EV/EBITDA alone isn't enough. Combine with: - Debt/EBITDA - debt sustainability (target <3x for healthy) - Interest Coverage Ratio (EBIT/Interest) - ability to pay interest (target >3x) - Free Cash Flow / EV - reality check vs EBITDA - ROIC - capital quality (see our article ROE vs ROA vs ROIC)
Step 4: Track Historical Trends
Today's EV/EBITDA alone isn't meaningful. Track 5-10 years: - Does the company trade at a stable or cyclical EV/EBITDA? - Is the ratio rising (sign of overvaluation) or falling (sign of undervaluation)? - Compared with sector EV/EBITDA - widening or narrowing gap?
Step 5: Consider Forward Catalysts
EV/EBITDA is a backward-looking metric. For investment decisions, consider: - Will EBITDA grow, decline, or stay stable over the next 3-5 years? - Will debt increase (acquisition) or decrease (deleveraging)? - What catalysts will re-rate the multiple?
EV/EBITDA in Shariah-Compliant Investing Context
For Malaysian Muslim investors, additional considerations:
Shariah Screening Related to Debt
SC Malaysia's Shariah Advisory Council has thresholds for debt: - Conventional debt / total assets: max 33% - Cash + interest-bearing investments / total assets: max 33% - Plus business activity filters
Companies with high debt-to-EBITDA may also have high debt-to-total-assets - at risk of being dropped from the Shariah-Compliant list.
Practical implications: - TENAGA (1295): historically Shariah-compliant - GENTING (3182): NOT Shariah-compliant (casino business + high debt) - MAYBANK (1155): NOT Shariah-compliant (conventional bank) - AAX: status fluctuates
Always refer to the latest SC Shariah-Compliant list before investing.
FAQ: Common Questions
1. What's the simple difference between EV/EBITDA and PE?
PE = share price × total shares, divided by net profit (after interest and tax). EV/EBITDA = total company value (including debt), divided by EBIT + D&A.
EV/EBITDA is neutral to capital structure. PE is distorted by debt.
2. When is EV/EBITDA considered "cheap"?
Depends on sector. Generally: - <6x: potentially cheap for mature sectors - 6-12x: fair for most sectors - >15x: expensive unless significant growth
But always compare with peers and historical median.
3. Can EV/EBITDA be negative?
EV rarely goes negative (except when cash > market cap + debt - rare). EBITDA can be negative for loss-making operations. If EBITDA is negative, EV/EBITDA isn't meaningful - use other metrics (Price/Sales, Price/Book).
4. Why does Munger hate EBITDA?
Munger feels EBITDA "ignores real cost" namely interest, tax, and D&A that will be paid eventually. For Munger, Free Cash Flow is more accurate as a measure of shareholder value. His quote: "Think of the word - it should be substituted with 'bullshit earnings'."
But - Munger usually invests in low-debt, high-quality companies. For leveraged companies, EV/EBITDA is still superior to PE.
5. As a retail investor, do I need to calculate EV/EBITDA manually?
No. Platforms like i3investor, Stockbit, or Bursa Malaysia Marketplace show pre-calculated EV/EBITDA. But check the definition - some include lease, some don't. Verify with 1-2 platforms for consistency.
6. What's the difference between EV/EBITDA and Debt/EBITDA?
- EV/EBITDA = valuation multiple (how many times EBITDA the company is valued at)
- Debt/EBITDA = leverage ratio (how many years of EBITDA needed to pay off debt)
High EV/EBITDA = expensive. High Debt/EBITDA = highly leveraged.
7. Is EV/EBITDA useful for penny stocks?
Less useful. Penny stocks typically have: - Volatile or negative EBITDA - Unreliable data - Speculation-driven, not fundamental-driven
For penny stocks, focus on catalyst news + technical setup instead.
8. EV/EBITDA vs EV/EBIT - when to use which?
- EV/EBITDA: ignores D&A. Suitable for asset-heavy companies where D&A is high.
- EV/EBIT: includes D&A. Suitable for asset-light (tech, services) where D&A is low and doesn't distort.
Bond/credit world conventions use EV/EBITDA. Equity analysts sometimes use EV/EBIT to capture capex impact indirectly.
Conclusion
EV/EBITDA is a valuation tool superior to PE for high-debt companies - utilities, telco, casinos, mega construction, and capital-intensive industries. It neutralizes distortions from capital structure and D&A, enabling apple-to-apple comparison between companies with different leverage. However it has weaknesses - even Munger called EBITDA "bullshit earnings" - so always combine with Free Cash Flow, ROIC, and Debt/EBITDA for a complete picture.
Before making any investment decisions, ensure you have an active trading account and a strong fundamental analysis framework.
To start investing in Bursa Malaysia and overseas markets like the US and Hong Kong, you need a CDS account - register your CDS account with Mahersaham here.
For stock investing fundamentals including how to read financial statements and detailed financial ratio formulas, get our free stock investing fundamentals ebook.
Further Reading
- ROE vs ROA vs ROIC: 3 Real KPIs Expert Investors Track - Quality KPIs related to the EV/EBITDA framework
- ROE vs ROA: Easy Way to Measure Company Management Efficiency - DuPont decomposition basics
- Construction Stocks: MRT3 & When the Cycle Recovers - Capex-heavy sector suited for EV/EBITDA
- Plantation Stocks: CPO Cycle & When Investors Should Enter - Cyclical EV/EBITDA analysis
- 5 Markets, 5 Tick Sizes: Bursa Stocks, US, Forex, Soy & FCPO - Broader financial market context for investors