ROE vs ROA vs ROIC: 3 Real KPIs Expert Investors Track (Not Just PE)

Most Bursa Malaysia retail investors know only one financial ratio: PE (Price-to-Earnings). "Maybank's PE is low, so it's cheap - buy." "Tenaga's PE is high, so it's expensive - wait for it to drop." This thinking isn't wrong - but it's too shallow to distinguish quality companies from garbage stocks.
Expert investors like Warren Buffett, Charlie Munger, and Terry Smith focus on three other KPIs: ROE (Return on Equity), ROA (Return on Assets), and ROIC (Return on Invested Capital). These three answer questions that PE cannot answer - namely: "How well does this company use the capital given to it?"
In this article, we unpack: - Simple formula for each KPI (you can calculate yourself from annual reports) - What each KPI actually measures - and when to use which - Why Buffett favors ROE, Munger favors ROIC, and the philosophical difference - Practical examples from Bursa Malaysia (KLCC, Nestle Malaysia, Maybank, Tenaga) - SC Malaysia's MY Value Up initiative requiring listed companies to disclose ROE & ROIC - Why 46% of top 500 Bursa companies actually have low ROE - and what it means - How to combine these KPIs to filter your watchlist
Why PE Alone Isn't Enough
Imagine two mamak restaurants.
Mamak A owns its premises for RM500,000. Net profit RM50,000/year. ROE = 10%.
Mamak B rents premises at RM5,000/month. Capital only RM50,000 for equipment. Profit RM30,000/year. ROE = 60%.
Which mamak is more efficient? Mamak B. Because with much smaller capital, it generates a much higher percentage return to the owner.
But by PE alone, you might pick Mamak A because absolute profit is higher.
This is PE's problem: it only shows price vs profit, but doesn't show how much capital is needed to generate that profit. Investors who focus on PE alone miss the difference between "compounder" companies (generate high returns on small capital) and "capital-heavy" companies (need large capital for ordinary profit).
Bursa Malaysia through the "MY Value Up" initiative launched by SC Malaysia in 2025, now encourages listed companies to disclose ROE, ROIC and total shareholders' return - not just EPS. This is official recognition that capital quality ratios are more meaningful than EPS growth alone.
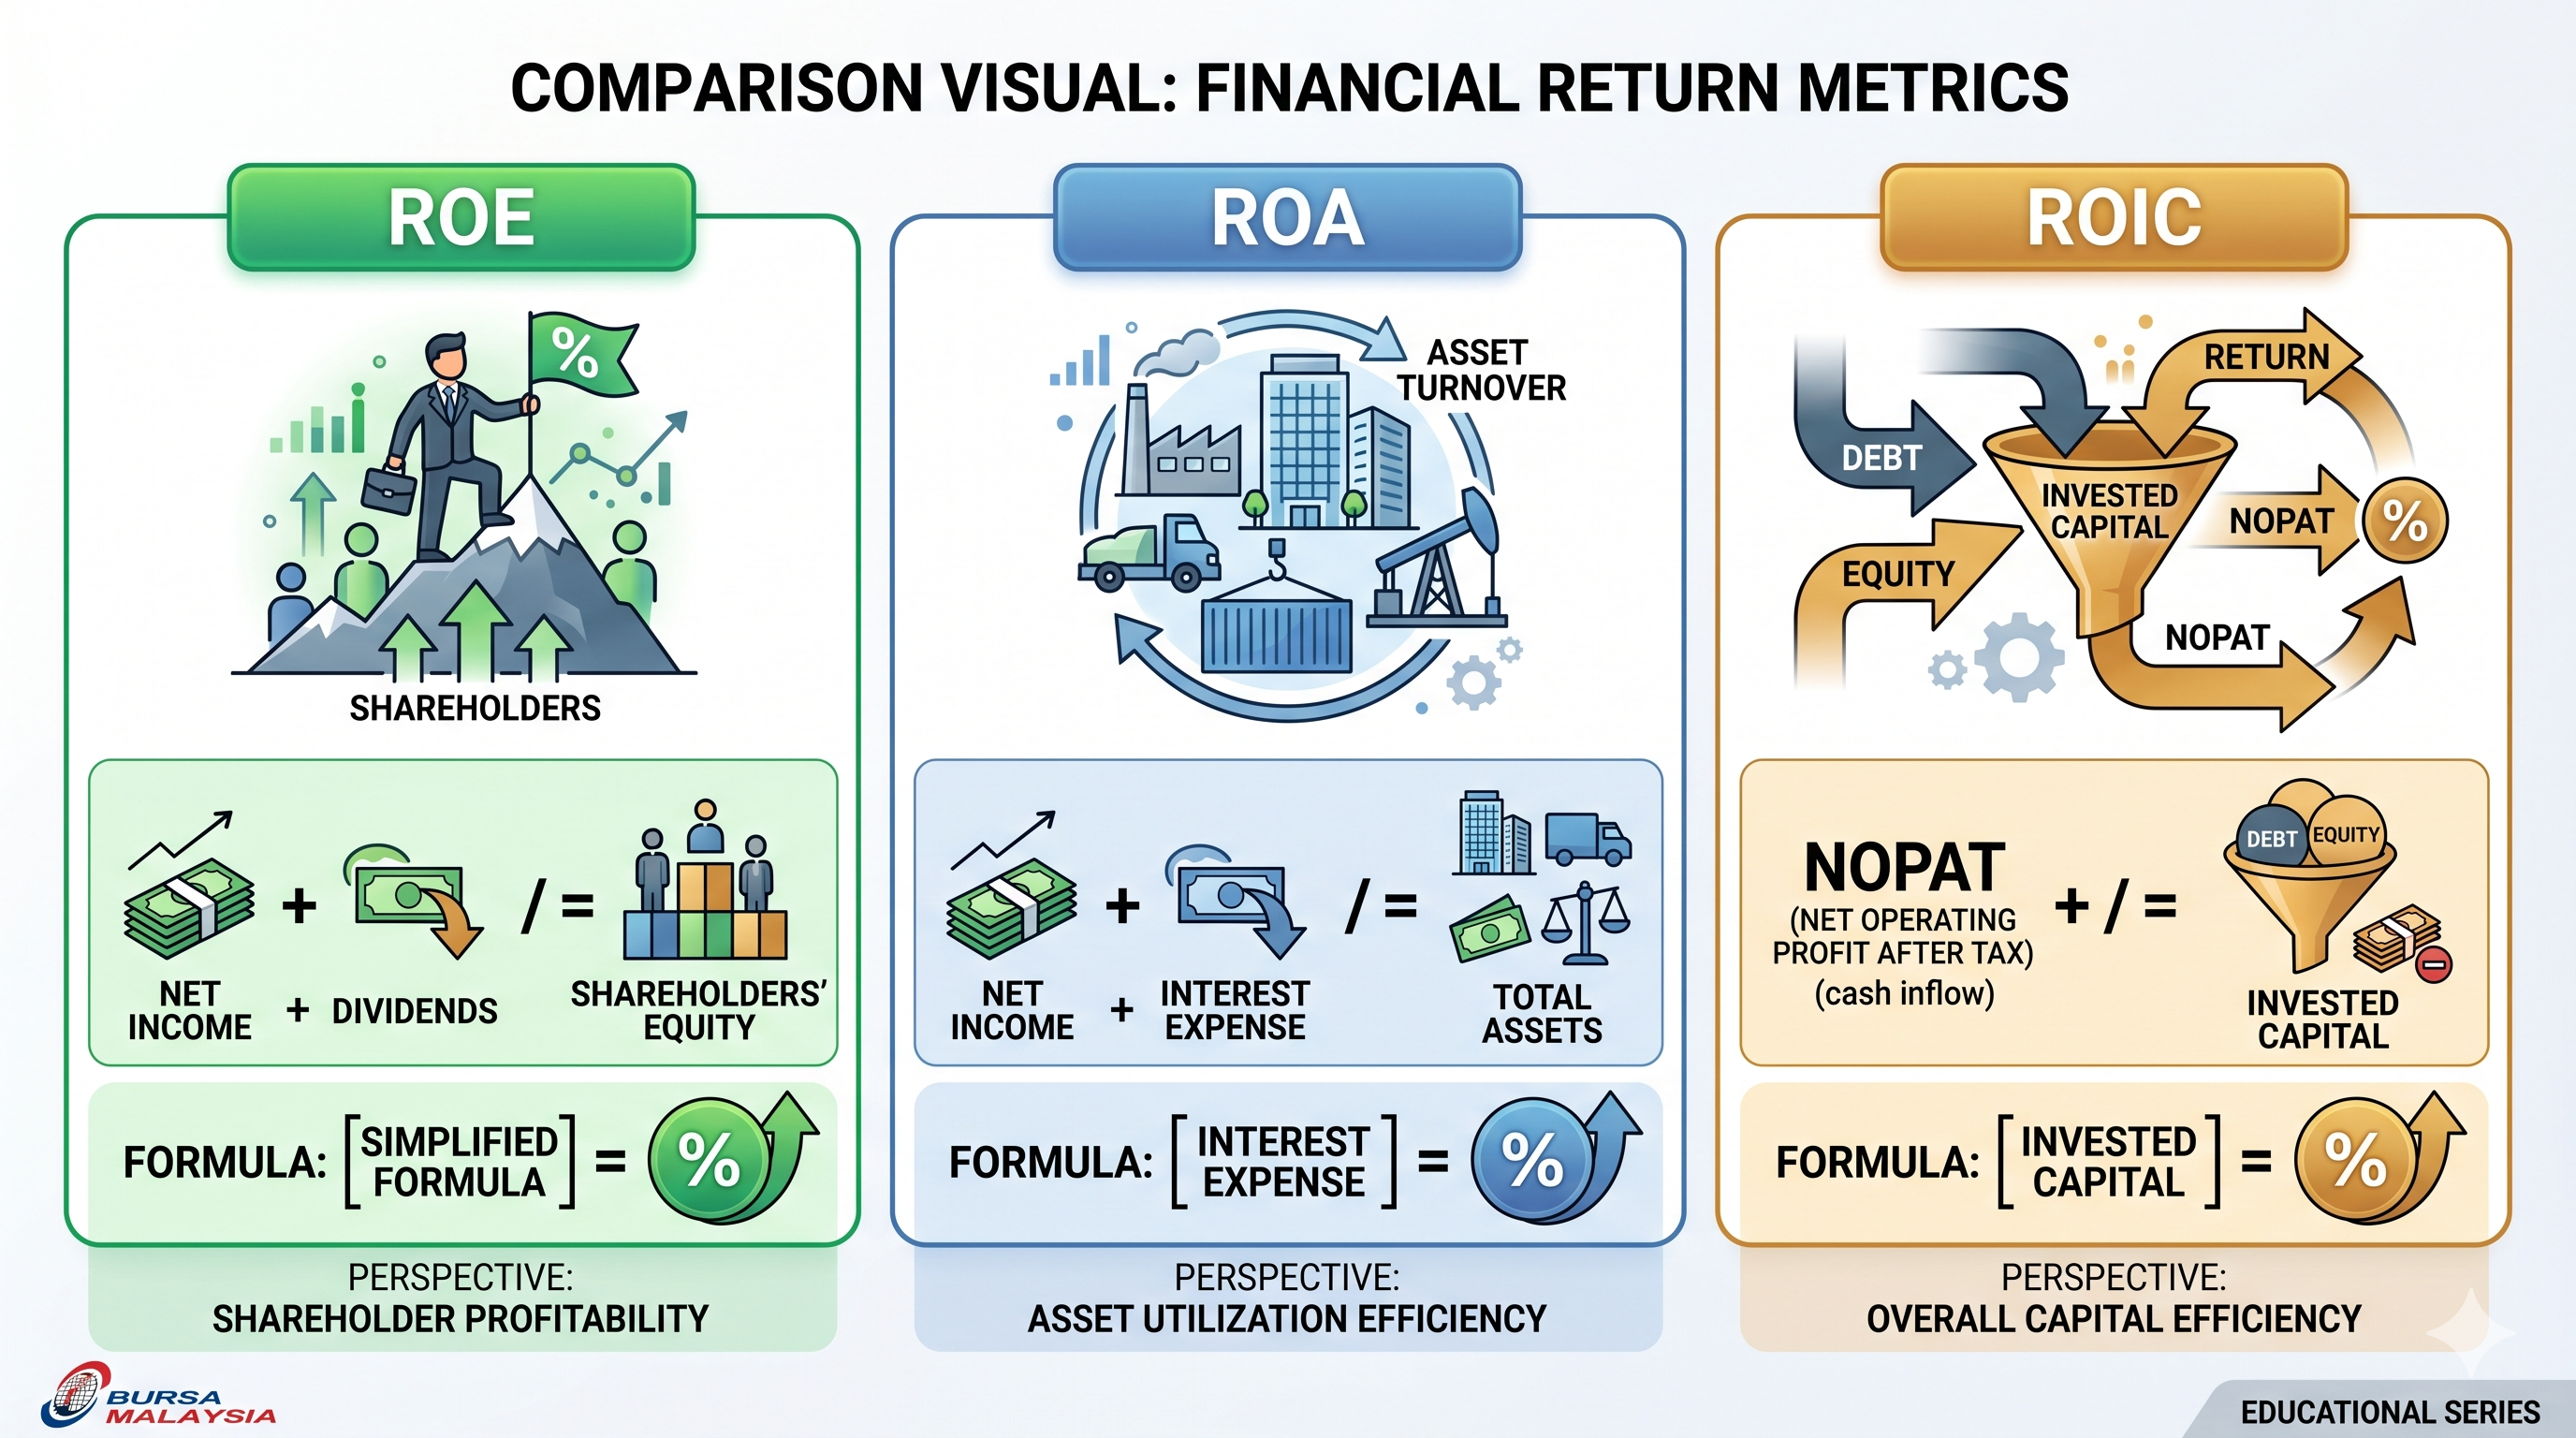
KPI #1: Return on Equity (ROE)
Formula
You can get all data from the Statement of Financial Position (net profit) and Statement of Equity (total equity) in annual reports.
What ROE Tells You
ROE answers: "For every RM1 of shareholder capital invested, how many cents of profit does the company generate?"
Buffett, in his letters to Berkshire Hathaway shareholders, requires consistent ROE >20% over 10 years as his primary screen. In Buffett's philosophy, companies that maintain high ROE without rising debt are moat businesses - they have structural competitive advantage.
Bursa Malaysia ROE Examples
| Company | ROE FY2024 | Category |
|---|---|---|
| Nestle (M) Berhad | ~80-100% | High moat (brand power) |
| Petronas Gas | ~15-18% | Stable utility |
| Maybank | ~10-12% | Traditional bank |
| AirAsia X | Negative/volatile | Asset-heavy + leverage |
| Bursa Malaysia FY2026 target | 27-30% (source: berita.rtm.gov.my) | High-quality exchange operator |
Important note: Nestle Malaysia's ROE appears extraordinarily high (~80-100%) because their equity book value is low - they return much capital to shareholders via dividends. This "artificial" high ROE must be paired with ROIC for confirmation (see KPI #3).
ROE Weakness
ROE can be manipulated with debt. This is because:
(DuPont decomposition - refer to our article ROE vs ROA: Cara Mudah Ukur Kecekapan Pengurusan Syarikat for breakdown).
Companies that borrow heavily can artificially "boost" ROE. Banks with 10-12x leverage naturally have ROE of 10-15% even with small net margins. But it doesn't mean they're efficient - they're just leveraged.
KPI #2: Return on Assets (ROA)
Formula
What ROA Tells You
ROA answers: "For every RM1 of assets the company owns (machinery, buildings, inventory, cash), how many cents does it generate as profit?"
Regardless of whether those assets are financed by equity or debt - ROA looks at overall asset utilization efficiency.
When to Use ROA
ROA is most useful for: - Banks and financial institutions - because their assets (loan book) are the main income source. Maybank's ROA of ~1.0-1.2% may look low, but is a norm for Asian banks. - Capital-intensive industries - construction, manufacturing, telco. Compare their ROA with peers, not with other sectors. - Comparing two companies with different debt structures - because ROA excludes leverage impact.
Bursa Malaysia ROA Examples
| Company | Sector | Approx ROA | Comment |
|---|---|---|---|
| Petronas Chemicals | Manufacturing | ~6-8% | Asset-heavy, normal |
| Maybank | Bank | ~1.0-1.2% | Banking norm |
| Public Bank | Bank | ~1.3-1.5% | Higher than Maybank |
| PETGAS (Petronas Gas) | Utility | ~7-9% | Pipeline infrastructure heavy |
| MYEG | Tech/services | ~15-20% | Asset-light model |
Insight: Compare within the same sector. ROA 5% for a bank is disaster; ROA 5% for a telco is normal.
ROA Weakness
- Doesn't account for capital structure - companies with heavy debt may have okay ROA but weak solvency.
- Total assets include goodwill that may not reflect real value.
- For financial institutions, compare only among banks - not with retailers.
KPI #3: Return on Invested Capital (ROIC)
Formula
Where: - NOPAT = EBIT × (1 - Tax Rate) - Invested Capital = Total Debt + Shareholders' Equity - Cash & Equivalents
What ROIC Tells You
ROIC is the purest KPI. It asks: "For every RM1 of operating capital the company uses (from debt + equity, minus idle cash), what return does it generate from its core operations?"
Charlie Munger has repeatedly stressed ROIC is the most important ratio. His famous quote:
"Over the long term, it is hard for a stock to earn a much better return than the business which underlies it earns. If a business earns 18 percent on capital over 20 or 30 years, even if you pay an expensive-looking price, you'll end up with a good result."
Meaning: if a company can maintain ROIC of 18% for 20-30 years, even if you buy at what appears to be an expensive valuation, you'll end up with a good result. Why: company profits compound at the 18% rate annually.
ROIC vs WACC: The Real Test
Important concept: compare ROIC with WACC (Weighted Average Cost of Capital).
- ROIC > WACC: company creates value (value creation)
- ROIC < WACC: company destroys value (value destruction)
- ROIC = WACC: company merely returns cost of capital - no value added
Imagine: if a company has cost of capital 8% (WACC) but ROIC of only 5%, they actually lose money every year in economic terms - even though book accounting shows profit.
McKinsey research shows companies with ROIC >20% have 50% probability of maintaining that level after 10 years. Only 13% of high-growth companies can maintain >20% growth after 10 years. Implication: ROIC is more stable and predictable than revenue growth.
Bursa Malaysia ROIC Examples
ROIC is hard to calculate precisely without detailed data, but rule of thumb:
| Category | ROIC Estimate | Bursa Example |
|---|---|---|
| Great compounder | >25% | Nestle Malaysia, Aeon Credit |
| Quality business | 15-25% | Public Bank, Petronas Gas |
| Average business | 8-15% | Maybank, CIMB, IJM |
| Value destroyer | <8% (or <WACC) | Many GLC transportation, high-gearing properties |
ROIC Weakness
- Harder to calculate than ROE/ROA - need to dig deeper into annual reports
- Definition of invested capital not standardized - some analysts include lease liabilities, others don't
- For banks, ROIC is less relevant - use ROA + ROE instead
Quick Comparison: ROE vs ROA vs ROIC
| Aspect | ROE | ROA | ROIC |
|---|---|---|---|
| What it measures | Return to shareholders | Asset efficiency | Return on operating capital |
| Formula numerator | Net Profit | Net Profit | NOPAT (EBIT × (1-tax)) |
| Formula denominator | Equity | Total Assets | Debt + Equity - Cash |
| Leverage impact | High (boost with debt) | None (excludes capital structure) | Moderate (counts debt as capital) |
| Best for | Within-sector comparison | Banks, capital-intensive | All non-financial sectors |
| Experts who favor it | Warren Buffett (>20%) | Bank analysts | Charlie Munger, Terry Smith |
| Buffett/Munger target | >20% consistent | Bank: >1%, Manufacturing: >5% | >15-20% long-term |
| Can be manipulated? | Yes (leverage) | Somewhat (goodwill) | Hardest to manipulate |
When Is Each KPI Most Relevant?
Use ROE when:
- Comparing companies within the same sector with similar capital structure
- Tracking long-term quality - companies with consistent high ROE over 10 years = moat business
- Initial screening to shortlist quality companies
Use ROA when:
- Comparing banks
- Analyzing capital-intensive companies (manufacturing, telco, utility)
- Detecting "asset bloat" - companies accumulating assets without efficiency
Use ROIC when:
- You want one purest metric for quality
- Comparing companies with different capital structures (e.g., debt-heavy vs equity-only)
- Testing whether management creates value (ROIC > WACC) or destroys it (ROIC < WACC)
Bursa Malaysia Reality: 46% of Top 500 Companies Have ROE <8%
According to The Edge Malaysia, among the 500 largest companies by market cap on Bursa Malaysia, 232 (46%) generate ROE <8%. This is a stunning figure.
What Does This Mean?
8% is a rough estimate of Malaysia's cost of capital (cost of equity). ROE <8% means: - Shareholders could earn more from MGS 10-year sukuk (~4-5%) + risk premium - The company doesn't create economic value for shareholders - Capital is better invested in KLCI ETFs or returned to shareholders
Sectors That Often Underperform ROE:
- Agricultural GLCs (FELDA, FGV variant) - asset-heavy with slow execution
- Plantation companies (after the 2024-2025 CPO down cycle)
- Property developers (except those with large recurring income)
- Some construction firms with project execution issues
Sectors That Excel:
- Consumer staples (Nestle, Spritzer) - brand moat = pricing power
- Tier-1 banks (Public Bank, Maybank) - franchise stability
- Tech-enabled services (MYEG, GHL) - asset-light scaling
- Bursa Malaysia itself - target 27-30% FY2026
How to Combine KPIs to Filter Your Watchlist
Here's a practical approach for retail investors:
Step 1: Initial Screen
- Consistent ROE >15% over 5 years
- ROA >5% (if not a bank); >1% (if a bank)
- Estimated ROIC >12% and >sector WACC
Step 2: Quality Check
- High ROE supported by high margins or high asset turnover - not high leverage alone?
- ROA and ROIC consistent - no decline over the past 3-5 years?
- Capital allocation: profit reinvested at high ROIC or returned as dividends?
Step 3: Valuation
- After quality is confirmed, only then use PE/PB for valuation
- Quality + reasonable valuation = candidate for further consideration
- Quality + expensive valuation = keep on watchlist for pull-back
Why quality first, valuation second: because garbage companies at low PE remain garbage. PE 5x on a company with ROE -2% isn't a bargain - it's a trap of ongoing losses.
MY Value Up Initiative: SC Pressure for ROIC Disclosure
In 2025, SC Malaysia launched the "MY Value Up" program which encourages listed companies to: 1. Disclose value creation KPIs in annual reports 2. Set specific, auditable ROE/ROIC targets 3. Communicate clear capital allocation strategies
This initiative is influenced by similar programs in Japan (Tokyo Stock Exchange's "Action to Implement Management Conscious of Cost of Capital and Stock Price") and Korea (Value-Up Programme).
Implications for Bursa Malaysia investors: - More companies will disclose ROE/ROIC targets in 2026-2027 annual reports - You can compare target vs achievement - companies missing targets consecutively = governance red flag - The era of "EPS growth at all cost" is nearing its end - capital quality becomes the focus
Common Retail Investor Mistakes
1. "Low PE = Cheap"
Wrong. PE 4x on a bank with 2% ROE is more expensive than PE 25x on a company with 30% ROIC growing 15% per year.
2. "High ROE = Must Be Good"
Not necessarily. Examine source of high ROE with DuPont decomposition. If from leverage alone, it's not sustainable.
3. "Low ROA = Company Inefficient"
Cannot generalize - banks naturally have low ROA (1%). Compare within sector only.
4. "I Don't Understand ROIC, Just Skip It"
Precisely because it's hard, it's an edge for investors willing to learn. Most Bursa Malaysia retail investors don't calculate ROIC. Those who understand have better filters than 90% of other retail investors.
5. "Different Sectors Have Different KPIs?"
That's why compare apple to apple: - Banks: focus ROA + ROE - Properties: ROA not meaningful, focus on ROE + asset turnover - Tech/services: ROIC + margins (since asset-light) - Plantation/commodity: cycle-adjusted ROE/ROIC
FAQ: Common Questions
1. When I calculate these KPIs, where do I get the data?
From the company's annual report available on Bursa Malaysia's website or the company's IR (investor relations) page. For a quick view, i3investor shows pre-calculated ratios. Calculate yourself for deeper understanding.
2. How many years of ROE/ROA/ROIC data should I check?
Minimum 5 years. Ideally 10 years. Because economic cycles fluctuate - quality companies show consistent KPIs across cycles. A company with 25% ROE during the 2024 bull market but -5% during the 2008 bear may not be a true compounder.
3. I'm a retail investor with small capital - is sticking to ROIC really meaningful?
Yes, even more important for you. With limited capital, you can't diversify into 50 stocks. You need to pick <10 high-quality stocks. ROIC is the best filter to identify quality businesses to hold long-term.
4. What's the difference between ROIC and ROCE?
ROCE (Return on Capital Employed) is very similar. Differences: - ROIC = NOPAT / Invested Capital (Debt + Equity - Cash) - ROCE = EBIT / Capital Employed (Total Assets - Current Liabilities)
ROCE doesn't adjust for tax. For UK/EU companies, ROCE is more common. For US/MY companies, ROIC is more common.
5. Nestle Malaysia's ROE >80% - is it sustainable?
The "artificial" high ROE is because Nestle pays large dividends - reducing equity book value. Their ROIC is also high (~30%+) - that's the real sustainability. So: pairing ROE + ROIC is essential.
6. If a company is new (IPO <3 years), how do I evaluate KPIs?
Difficult. With short historical data, assume uncertainty premium. Compare with established peers in the same sector. Wait 3-5 years for track record before committing large capital.
7. Do Shariah-compliant stocks need special KPIs?
No - same KPIs apply. But check Shariah compliance status at SC Shariah Advisory Council website. For strict Muslim investors, screen Shariah first, then filter KPIs.
8. I don't have time to calculate manually - what tools should I use?
Several options: - i3investor - free, basic latest ratios - ShareInvestor - subscription, full historical data - Stockbit (Indonesia, partial MY coverage) - free + paid tier - Custom Excel/Google Sheets - import from Bursa filing, custom formulas
I recommend calculating yourself for your top 5-10 stocks - you'll understand better what's behind the numbers.
Conclusion
PE is the most popular ratio because it's easy to calculate, but it's a valuation tool, not a quality tool. To distinguish quality companies from garbage stocks - and to think like Buffett, Munger, or Terry Smith - you need to focus on ROE, ROA, and ROIC first, then use PE/PB at the end for entry point valuation. 46% of top 500 Bursa Malaysia companies have ROE <8%, meaning half the market doesn't create economic value - and low PE doesn't save them.
Before making investment decisions, ensure you have an active trading account and a strong fundamental analysis framework.
To start investing in Bursa Malaysia and overseas markets like the US and Hong Kong, you need a CDS account - register your CDS account with Mahersaham here.
For stock investing fundamentals including how to read financial statements and detailed financial ratio formulas, get our free stock investing fundamentals ebook.
Further Reading
- ROE vs ROA: Easy Way to Measure Company Management Efficiency - Deeper explanation of DuPont decomposition
- Beyond NVIDIA: 8 Companies Profiting from the AI Boom - Quality screening applied to the AI theme
- Michael Burry: Today's Market Feels Like 1999-2000 Bubble - Risk management & quality vs valuation
- Plantation Stocks: CPO Cycle & When Investors Should Enter - Cycle-adjusted ROE/ROIC in commodities
- Game Theory Stock Trading - Applying thinking frameworks to investment decisions