How to Use the Mahersaham Screener: 90+ Automated Scanners for Bursa & US Stocks

More than 900 counters trade on Bursa Malaysia every day. If you checked each chart one by one looking for stocks that fit your criteria, a week would not be enough. That is exactly what a screener is for - and at mahersaham.com, we provide over 90 automated scanners that do this filtering work for you every single day.
In this tutorial, we walk you step by step through the mahersaham.com/screener page: from choosing a scanner and reading the results table, to viewing full charts with buy and sell signals.
What Is a Stock Screener?
In short, a stock screener is a tool that filters the entire market based on specific criteria - for example stocks that just broke out, RSI crossing above 30, or a MACD cross to the upside. From the 900+ counters on Bursa Malaysia, a screener shortens the list to just a dozen or so counters that meet your conditions.
Here is what makes it different from a typical screener: at mahersaham.com, you do not need to set any parameters. Every scanner is pre-programmed with specific technical criteria, and our system scans the entire market automatically every day once trading data is updated. All you do is open the list and view the results.
The screener is one of the platform's main menus - if you are new to mahersaham.com, start with our guide to every platform menu for the full picture.
Step 1: Open the Screener Page & Get to Know the Interface
Go to mahersaham.com/screener. You will see the "Stock Scanners" page like below:
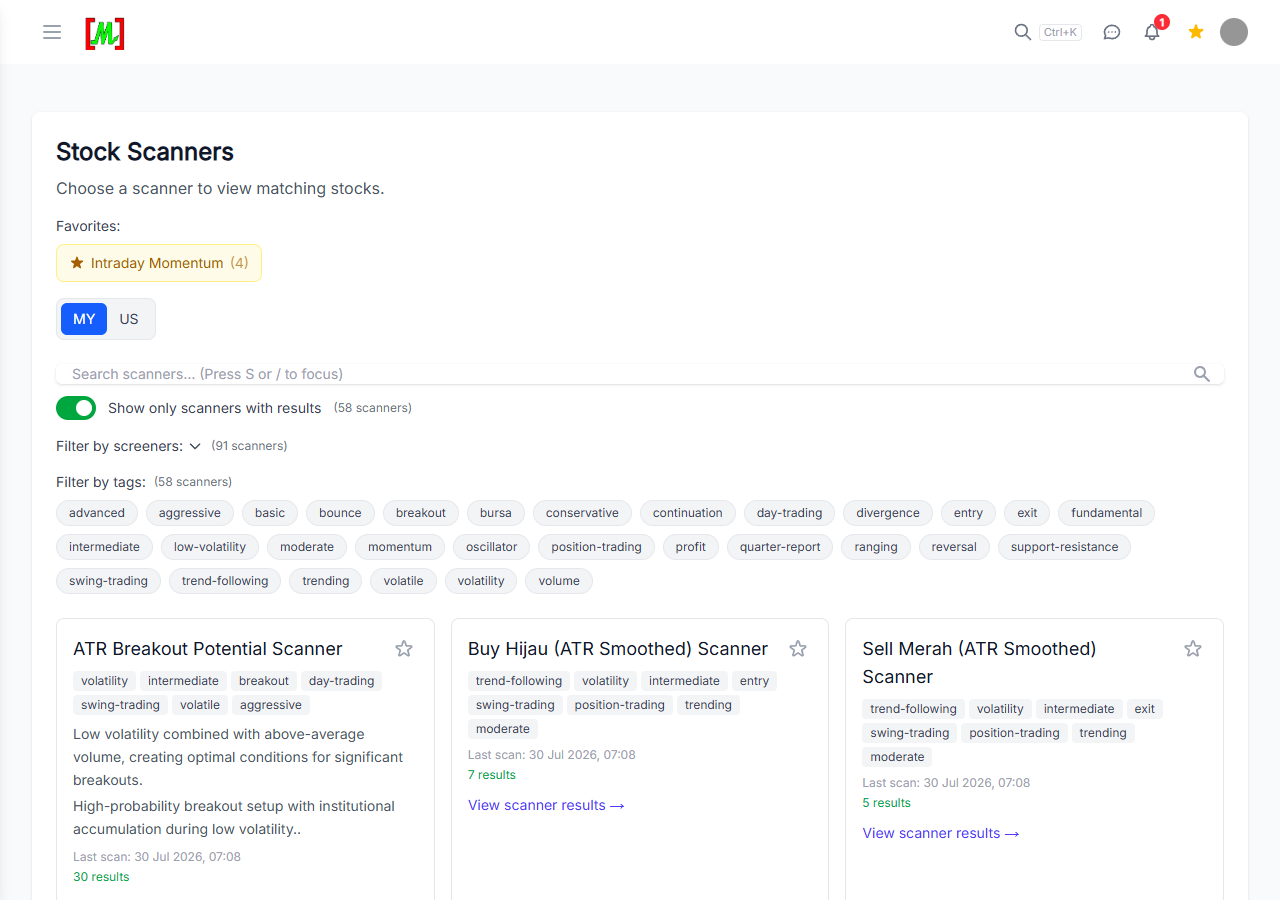
These are the key functions on the main page:
- MY / US tabs - switch between scanners for Bursa Malaysia and the US stock market. Each market has its own set of scanners.
- Search box - type a scanner name to find it quickly. Shortcut: press S or / on your keyboard to jump straight to the search box.
- Show only scanners with results - this toggle filters the list to show only scanners with results today. Out of 90+ scanners, typically 50-60 have results on any given day.
- Filter by tags - filter scanners by categories such as basic, intermediate, advanced, breakout, momentum, reversal, swing-trading, day-trading and many more. Very useful for finding scanners that match your trading style.
- Favorites - click the star icon on any scanner to save it as a favourite. Favourite scanners appear at the top of the page for quick access.
The page is fully responsive - you can use it from your phone on the go, but for serious analysis sessions we recommend a computer screen so the results tables and charts are easier to read. If you use the screener often, get comfortable with the keyboard shortcuts: S or / for search, and G in the chart view for multiple timeframe analysis.
Step 2: Choose the Right Scanner
Every scanner card shows the information you need before clicking:
- Scanner name - for example ATR Breakout Potential, Buy Hijau (ATR Smoothed), Golden Cross Advanced, MACD Bullish Divergence, or VCP Squeeze + Ichimoku Combo
- Tags - difficulty level (basic/intermediate/advanced) and the trading styles it suits
- Short description - what the scanner looks for and when it is useful
- Last scan - the date and time of the latest scan, so you know the data is current
- Result count - how many counters passed the filter today
For beginners, start with basic-tagged scanners such as MACD, MA50 Cross Buy or RSI Cross - the concepts are easy to grasp and widely covered in the Mahersaham video courses. Experienced traders can go straight to advanced scanners such as the Ichimoku combinations, VCP Squeeze or Darvas Box.
There are also fundamental scanners such as High Dividend Yield, Magic Formula, Profitable Quarter Reports and Upcoming Dividend - for those leaning towards long-term investing rather than trading.
8 Popular Scanners & When to Use Them
With 90+ choices, you may wonder where to start. These are among the scanners most used by the Mahersaham community and the situations each one suits:
- ATR Breakout Potential - finds stocks with low volatility but above-average volume, a combination that often appears before major breakouts. Great for detecting early accumulation.
- Buy Hijau / Sell Merah (ATR Smoothed) - trend-following signals based on smoothed ATR. Buy Hijau for entries when an uptrend begins, Sell Merah as an exit warning when the trend turns.
- Bollinger Bands Squeeze Potential - detects stocks trading in a tight range (squeeze), a condition that usually precedes a large price move in either direction.
- Golden Cross Advanced - a strengthened version of the classic MA50-crossing-MA200 pattern, with additional volume and momentum confirmation to reduce false signals.
- 52W Breakout + Momentum Combo - stocks breaking their 52-week high with momentum support. A favourite pattern among position traders chasing market leaders.
- Profitable Quarter Reports (5 Days) - stocks that just announced profitable quarterly reports within the last 5 days. Combines a fundamental element with technical timing.
- Jerung Masuk (IQR Volume Spike) - detects unusual volume spikes that may signal "big money" entering a counter.
- Intraday Momentum - for day traders: stocks with the strongest daily momentum. A premium scanner that is also among the most popular with Gold Members.
Step 3: Read the Scanner Results Table
Click any scanner to open its results table:
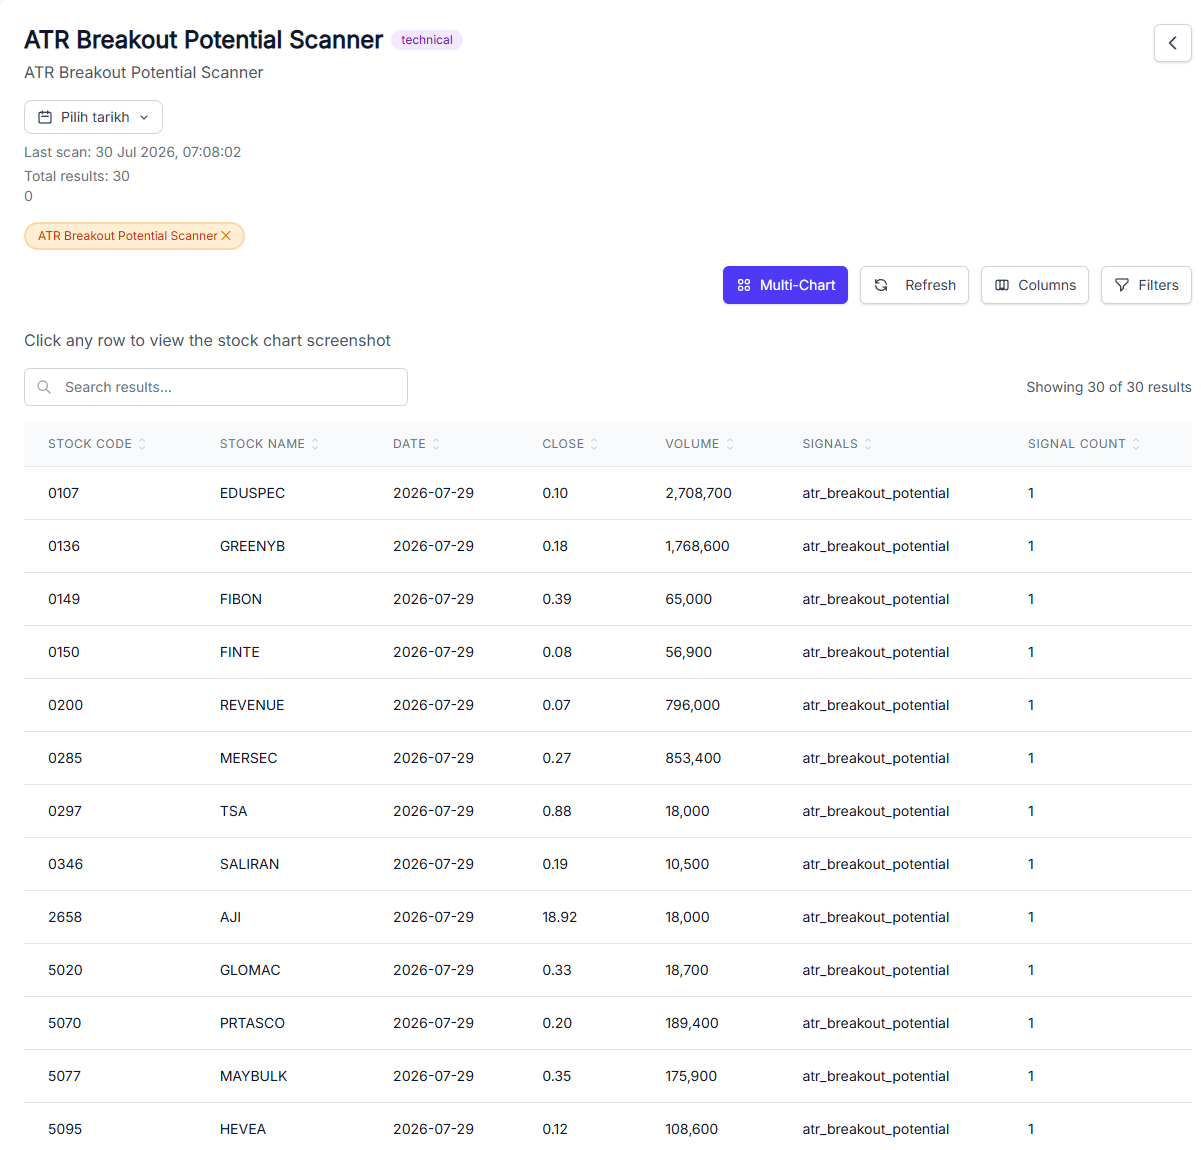
The table lists every counter that passed the filter, with Stock Code, Stock Name, Date, Close, Volume, Signals and Signal Count columns. A few extra functions many people miss:
- Sort - click any column header to sort results, for example by highest volume
- Search results - find a specific counter within the results list
- Columns - add or remove displayed columns
- Filters - refine results with extra conditions such as price range or minimum volume
- Pick a date - view scan results from previous days. The full scan history is stored, so you can check what a scanner found last week and how those picks performed afterwards
- Multi-Chart - display all counters in the results as a grid of charts at once, perfect for fast visual scanning
Important note: Anyone can view the scanner list, but you need to log in to open the results tables. Registering a mahersaham.com account is free - see how to sign up for a Mahersaham account.
Step 4: Click a Row to View the Full Chart
This is the most powerful part. Click any row in the table and the counter's full chart opens - complete with indicators and Buy/Sell signals drawn on a TradingView chart:
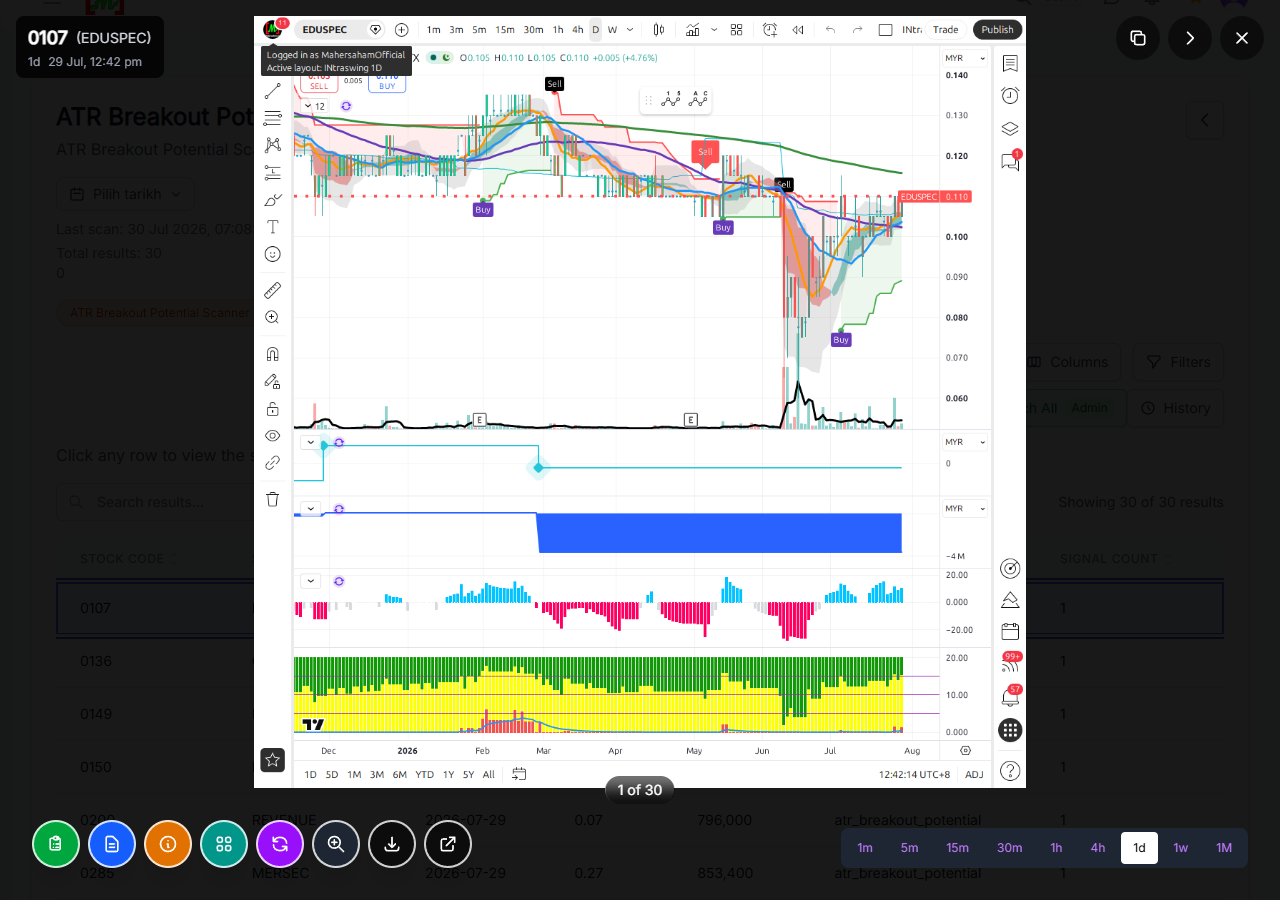
In this chart view you can:
- Switch timeframes - from 1 minute to 1 month (1m, 5m, 15m, 30m, 1h, 4h, 1d, 1w, 1M)
- Next stock - jump straight to the next counter in the results without closing the view (see the "1 of 30" indicator at the bottom)
- Create Trading Plan - build a trading plan for that counter directly from the chart
- Stock Research - jump to the counter's full stock research if available
- Multiple Timeframe Analysis - press G for simultaneous multi-timeframe analysis
- Download / Copy URL - save the chart or share the link with trading friends
Free vs Premium Scanners
Most scanners are open to all registered members for free, including basic scanners such as MACD, MA50 Cross Buy, Month High/Low, PSAR Buy, RSI Cross and Stochastic Cross. Fundamental scanners such as High Dividend Yield and Magic Formula are also available.
A few extra facilities are reserved for Gold Members:
- Premium scanners - for example Intraday Momentum, BTST, Uptrend (MA20 > MA50 > MA200) and IPO Scoring
- On-demand refresh - regenerate a scan at any time without waiting for the daily schedule
- Custom Screener - build your own scanner with your chosen criteria and backtest your strategy. We explain it fully in the Screener Backtest tutorial
How to Use a Screener Properly: 4 Key Tips
A screener is a tool for shortening your list - not a buy-signal machine. Here is how to use it wisely:
- Screen first, analyse after - scanner results are a shortlist. Before entering, open the chart, check the overall trend, support/resistance and the counter's news.
- Match the scanner to your style - if you are a swing trader, use swing-trading-tagged scanners; do not use an intraday momentum scanner for weekly holds.
- Review scan history - use the "Pick a date" function to see last week's results, then check how those counters performed. This is the fastest way to understand a scanner's strengths.
- Always manage risk - no scanner is 100% accurate. As the Securities Commission's InvestSmart initiative emphasises, decide your position size and cut-loss point before buying, not after.
Practical Example: A 15-Minute Nightly Screener Routine
To see how all these functions come together, here is a simple routine you can practise after the market closes:
- Open 2-3 favourite scanners (5 minutes) - for example ATR Breakout Potential for new ideas and Buy Hijau for trend confirmation. Star both as Favorites so they always appear at the top.
- Visual scan with Multi-Chart (5 minutes) - open the results in Multi-Chart mode and flip through the chart grid. Drop anything without a clear trend; keep the 3-5 cleanest counters.
- Full chart analysis (5 minutes) - click each shortlisted counter, check the 1d and 1w timeframes, identify the nearest support/resistance, and press G for multi-timeframe analysis.
- Plan before you buy - for counters that are genuinely interesting, use the Create Trading Plan button right from the chart: set your entry price, target and cut loss. The next morning you simply execute the plan instead of making rushed decisions while the market moves.
Consistency beats perfection - 15 minutes every night with the same process will build your market feel far faster than watching the market all day without direction.
FAQ
Is the Mahersaham screener free?
Yes, most scanners are free to access - you just need to register a mahersaham.com account and log in to view results. A few premium scanners and extra facilities such as the custom screener are for Gold Members.
How often is the screener data updated?
The system scans the entire market automatically every day once daily trading data is updated. The last scan time is shown on every scanner card, so you always know whether the data is current.
Which markets are covered?
Two markets: Bursa Malaysia (MY tab) and the US stock market (US tab). Each market has its own set of scanners.
What do the basic, intermediate and advanced tags mean?
These tags indicate the level of technical knowledge needed to understand the scanner's logic. Beginners should start with basic scanners such as MACD or RSI Cross before moving to advanced ones like the Ichimoku combinations or VCP Squeeze.
Can I view scan results from previous days?
Yes. Use the "Pick a date" button on a scanner's results page to open the scan history for any past date.
Are scanner results buy recommendations?
No. Scanners simply filter stocks based on preset technical criteria. They are a starting point for your own research, not investment advice. Always do further analysis and manage your risk.
How do I build my own scanner?
Gold Members can use the Custom Screener function to build scanners with their own criteria and backtest strategies. Read the full tutorial in our Screener Backtest article.
Is the screener suitable for beginners?
Very much so - a screener actually helps beginners focus. Instead of staring blankly at hundreds of counters, you start with a pre-filtered shortlist and learn to analyse those charts one by one. Start with basic-tagged scanners and pair them with the Mahersaham video courses.
Conclusion
The Mahersaham screener compresses hours of filtering 900+ Bursa counters into a few clicks - 90+ automated scanners, updated daily, complete with charts and signals for every result. Use it as the first step in your analysis routine, and let data decide your shortlist instead of emotion.
Found a promising counter through the screener? The next step is owning it.
Open a CDS trading account to start buying stocks on Bursa Malaysia as well as foreign markets such as the US and Hong Kong.
Just getting started? Download our free Stock Market Basics Ebook.