Mahersaham Markets: Track Bursa Indices, KLCI Stocks & Global Markets

Making informed investment decisions starts with understanding the big picture. Before zooming into individual stocks, experienced investors check the direction of major indices, sector performance, and global market sentiment. On mahersaham.com, all of this lives on a single page: Markets.
The Markets page is your central market monitoring hub. It brings together Bursa Malaysia indices, FBM KLCI component stocks, the S&P 500, commodities, crypto, and regional markets into one unified view. No need to open five different websites just to understand today's market conditions.
In this tutorial, we walk you through every section of mahersaham.com/markets so you can make it part of your daily analysis routine.
What Does the Markets Page Offer?
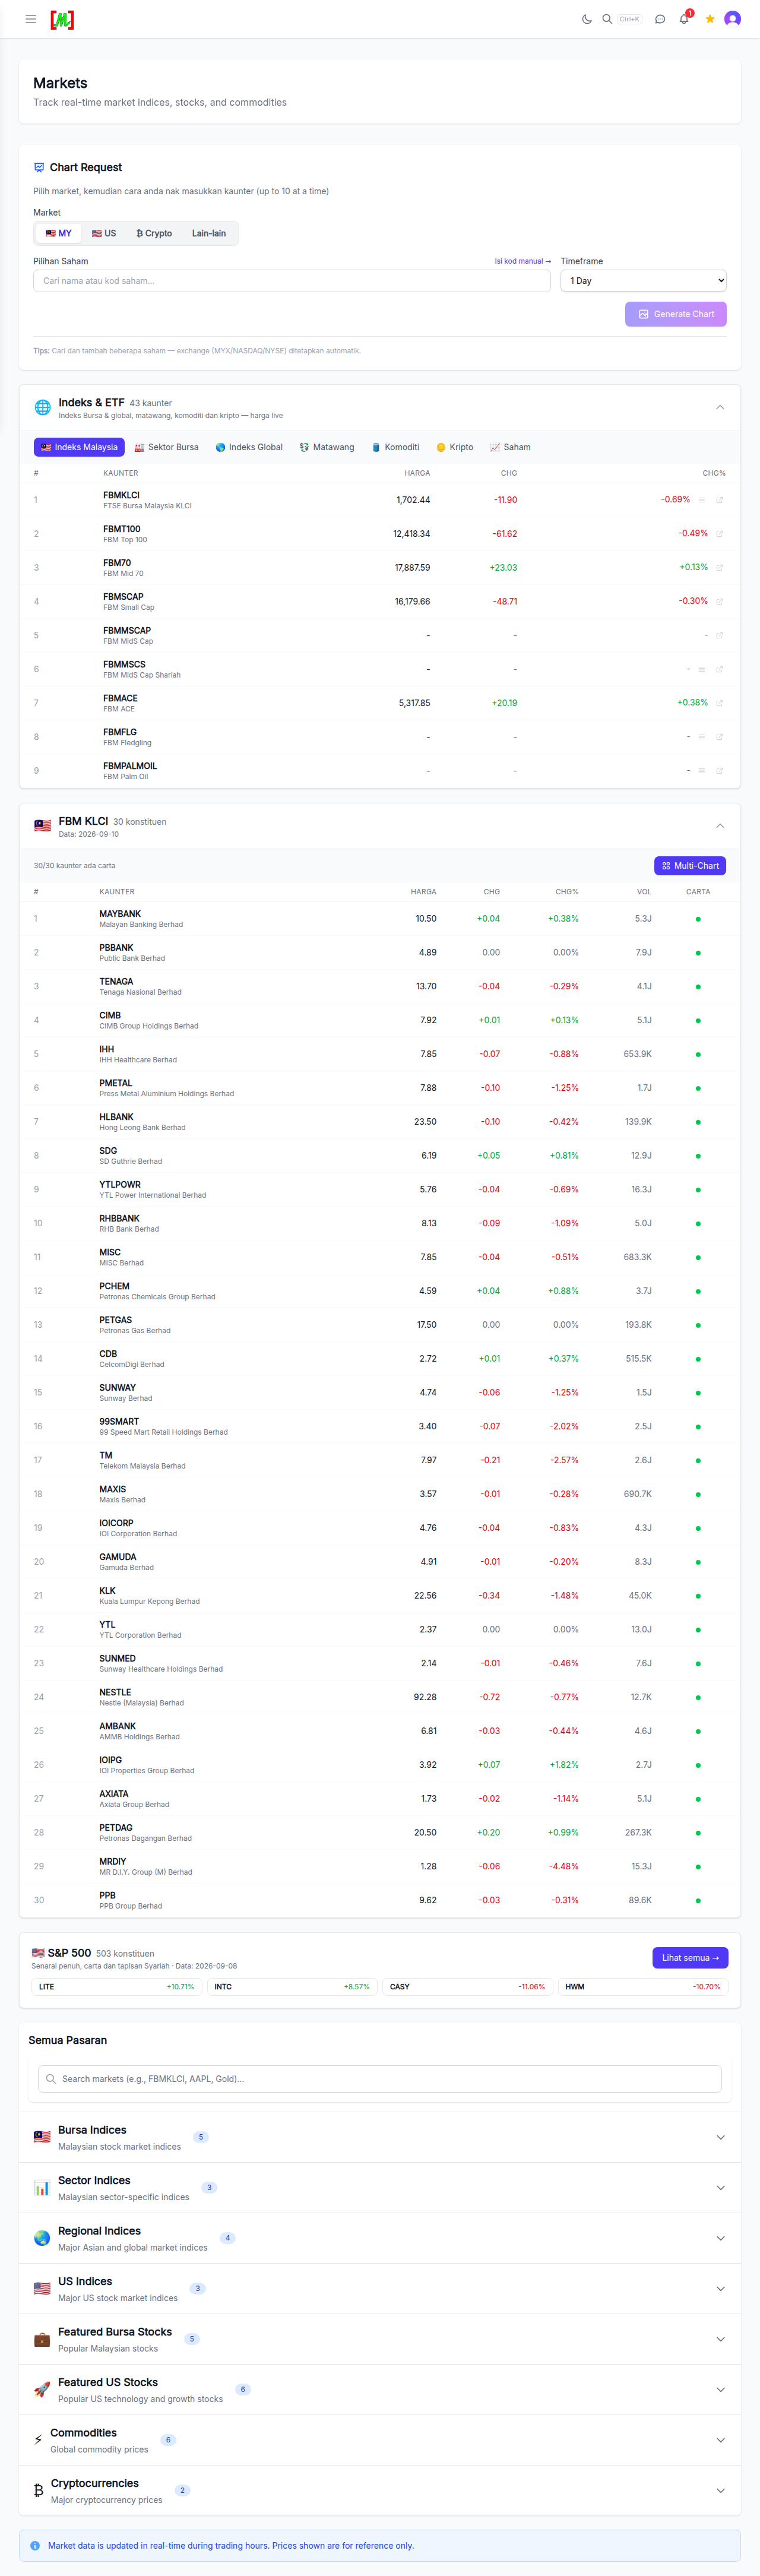
The Markets page is a one-stop dashboard for all major markets. It is designed so investors can get a complete market overview in seconds without switching between multiple sources. Here are the 5 main sections available:
- Chart Request - request charts for any market including Bursa stocks, global indices, US stocks, crypto, commodities and forex
- Index & ETF - a display of all major Bursa Malaysia indices with current prices and changes
- FBM KLCI 30 Stocks - a complete table of all 30 component stocks of Bursa's benchmark index
- S&P 500 - an overview of the US stock market
- All Markets (Sidebar) - quick navigation to 8 different market categories
This page is open to all users without requiring a Gold subscription. You only need to register a free account on mahersaham.com to access it. If you are not yet familiar with the other menus on the platform, read the complete guide to every Mahersaham menu first.
Section 1: Chart Request - Get Charts for Any Market
The first section you will find on the Markets page is Chart Request. This feature allows you to request technical charts for a wide variety of markets and financial instruments.
In this section, you will see several market tabs:
- Saham Bursa (Bursa Stocks) - all counters listed on Bursa Malaysia including the Main Market and ACE Market
- Index Global (Global Indices) - international market indices such as the Nikkei 225, Hang Seng, KOSPI, FTSE 100, DAX and many more
- US - stocks listed on the NYSE and NASDAQ such as Apple, Tesla, Nvidia, and Microsoft
- Crypto - major cryptocurrencies including Bitcoin, Ethereum, Solana, and BNB
- Lain-lain (Others) - commodities (gold, crude oil, CPO), forex pairs (USD/MYR, EUR/USD), bonds and other instruments
For each market, you can select either a Daily or Weekly timeframe. Daily charts suit swing traders looking for short-term opportunities, while weekly charts provide a broader trend picture for longer-term investors.
How to Use Chart Request
- Select the market tab you want (e.g., Saham Bursa)
- Type or select the counter/instrument (e.g., TENAGA, PBBANK)
- Choose Daily or Weekly timeframe
- Click the request button to generate the chart
The generated chart includes basic technical indicators and signals to help you make decisions. This feature is especially useful when you want to quickly check a chart without opening a separate charting application.
Section 2: Index & ETF - All Major Bursa Malaysia Indices
The next section displays a complete list of major indices and ETFs on Bursa Malaysia. This is the "pulse of the market" that shows you the overall market direction at any given time.
The indices displayed include:
- FBM KLCI - Bursa Malaysia's benchmark index comprising 30 large-cap stocks. This is the most widely referenced indicator for measuring Malaysian stock market performance
- FBMTSI - FBM Top Shariah Index tracking large-cap Shariah-compliant stocks
- FBMTO - FBM Top 100 Index covering the 100 largest companies
- FBMSC - FBM Small Cap Index for smaller companies. Typically more volatile but offering higher growth potential
- FBMACAP - FBM ACE Market Index specifically for companies listed on the ACE market
- FBMEMAS - FBM EMAS Index covering KLCI components and the Mid 70
- FBM70 - FBM Mid 70 Index for 70 mid-cap companies ranked after the KLCI 30
- FBMFLG - FBM Fledgling Index for even smaller companies
Each index is displayed with its current price and daily change (in points and percentage). Green indicates a gain, red indicates a decline. With a single glance, you can tell whether the overall market is bullish or bearish today.
Why Monitor Indices?
Many new investors jump straight into individual stock analysis without understanding the overall market direction. This is like trying to sail without knowing which way the wind is blowing. By monitoring indices:
- Determine market bias - when the KLCI and most indices are rising, the probability of individual stocks also rising is higher. Conversely, avoid aggressive buying when indices are falling
- Identify sector rotation - compare FBMSC (small cap) with the KLCI (big cap). If small caps are outperforming, it means retail investors are active and sentiment is more risk-on
- Filter opportunities - if the FBMTSI is rising faster than the KLCI, Shariah-compliant stocks are in focus. You can narrow your search to this segment using the Mahersaham Screener
Section 3: FBM KLCI 30 Stocks - Benchmark Index Component Table
This is the most referenced section by investors. The FBM KLCI 30 table lists all 30 component stocks of Bursa Malaysia's benchmark index, complete with essential trading information.
The columns displayed are:
- Kaunter (Counter) - stock code and name (e.g., PBBANK, TENAGA, CIMB)
- Harga (Price) - last traded price or closing price
- Chg (Change) - price change in sen compared to the previous day
- Open - opening price for the day
- %Chg (% Change) - price change in percentage. This is more useful for comparison as it accounts for the stock's base price
The 30 KLCI component stocks represent the largest and most liquid companies on Bursa Malaysia. They include major names like Public Bank, Maybank, CIMB, Tenaga Nasional, Petronas Chemicals, IHH Healthcare, and others. The component list is reviewed periodically by FTSE Russell and Bursa Malaysia.
How to Use the KLCI 30 Table
This table is not just for reading - it can be used actively in your analysis:
- Identify market movers - the KLCI stocks with the biggest gains or losses today are usually driving the index. If the KLCI is up 5 points but most components are down, the rally is driven by just 2-3 heavyweights and may not be healthy
- Spot laggard opportunities - during a market recovery, KLCI stocks that have not yet moved (laggards) sometimes offer catch-up opportunities. But make sure there is no fundamental reason why they are lagging behind
- Compare Open vs Current Price - if many components opened higher than their current price, selling pressure has increased throughout the day and you should be more cautious
Section 4: S&P 500 - US Market Overview
In the world of global investing, the US stock market is the largest and most influential. Movements on Wall Street often affect Asian markets including Bursa Malaysia the following day.
The S&P 500 section on the Markets page gives you a quick snapshot of the S&P 500 index performance, which tracks the 500 largest US companies. When the S&P 500 drops sharply overnight, you can typically expect a negative open on Bursa Malaysia the next morning, especially for stocks closely tied to global sentiment.
This helps you:
- Prepare before the market opens - check the S&P 500 before 9 AM Malaysian time so you know what to expect when Bursa opens
- Understand global sentiment - if the S&P 500, Nasdaq, and Dow Jones are all red, risk-off sentiment is dominating global markets. This is not the time for aggressive buying
- Track technology trends - many Malaysian technology stocks like Inari, Frontken, and ViTrox move in tandem with the US semiconductor sector. Monitoring the S&P 500 and Nasdaq helps you anticipate local tech stock movements
Section 5: All Markets - 8 Categories at Your Fingertips
In the sidebar of the Markets page, you will find the "Semua Pasaran" (All Markets) navigation that classifies the entire market landscape into 8 main categories. This makes it easy to jump directly to the market segment you are interested in:
- Bursa Indices - all official Bursa Malaysia indices including KLCI, FBMEMAS, FBMSC, FBMACAP, FBMTSI and others
- Sector Indices - indices by industry sector such as Banking, Technology, Property, Energy, and Healthcare. Extremely useful for identifying sector rotation within economic cycles
- Regional Indices - regional market indices such as STI (Singapore), SET (Thailand), JCI (Indonesia), PSEi (Philippines), and VN-Index (Vietnam). Helps understand capital flows within the ASEAN region
- US Indices - Dow Jones, S&P 500, Nasdaq Composite, and Russell 2000. These four indices provide different perspectives on the US market
- Featured Bursa Stocks - a curated list of the most popular and widely watched Bursa Malaysia stocks, typically including heavyweights like Maybank, CIMB, Tenaga and actively traded mid-cap stocks
- Featured US Stocks - US stocks most commonly watched by Malaysian investors such as Apple, Tesla, Nvidia, Microsoft, Meta and Amazon
- Commodities - major commodities including Gold, Crude Oil, Crude Palm Oil (CPO), Rubber, and Tin. As a major commodity exporter, Malaysia is significantly affected by price movements in these markets
- Cryptocurrencies - major cryptocurrencies such as Bitcoin, Ethereum, Solana, BNB and XRP. While not a traditional market, many modern investors also monitor crypto as part of their portfolio
Each category displays a list of instruments with their prices and latest changes, giving you a quick view of whether that category is trending up or down overall.
How to Incorporate Markets Into Your Daily Routine
To get maximum value, make the Markets page a fixed part of your analysis routine. Here is a sample monitoring routine you can adopt:
Morning (Before 9:00 AM - Pre-Market)
- Check the S&P 500 and US Indices - how did the US market close overnight? If red, expect a cautious open on Bursa
- Check commodities - did crude oil or CPO prices change significantly? This will affect related stocks like Petronas Chemicals, IOI Corporation and KLK
- Review Regional Indices - how are the Nikkei and Hang Seng opening? This gives early clues about Asian sentiment
Evening (After 5:00 PM - Post-Market)
- Review the KLCI 30 table - who are today's top gainers and losers? Was the movement driven by one or two heavyweights or was it broad-based?
- Compare indices - did the FBMSC outperform the KLCI? If so, small caps are strong and you can focus your search on this segment
- Use Chart Request - request charts for counters in your Watchlist to see today's movement in the context of the broader trend
Mahersaham Markets vs Other Data Sources
You might wonder why you should use the Markets page on mahersaham.com when market data is available from many sources. Here are the advantages:
- One page for everything - no need to open Bursa Malaysia for local indices, Yahoo Finance for US stocks, and CoinMarketCap for crypto separately. Everything is in a single view
- Integrated with analysis tools - from the Markets page, you can jump directly to the Screener to filter stocks, Stock Research for in-depth analysis, or Trading Plan to plan your trades. An integrated ecosystem saves time
- Focused on relevant markets - all markets and instruments displayed are selected based on their relevance to Malaysian investors. No irrelevant information cluttering your screen
- Free access - the Markets page is open to all registered users without requiring a Gold subscription
5 Tips for Using Markets Effectively
Here are some practical tips to get the most out of the Markets page:
- Observe, do not react - the purpose of monitoring indices is to understand market context, not to panic every time an index dips. A 0.5% daily decline is normal and is not a reason to sell all your holdings
- Compare relative movements - index movements are more meaningful when compared. If the KLCI drops 0.3% but FBMSC rises 1.2%, money is flowing from big caps to small caps. This is actionable information
- Watch market correlations - understand the relationships between markets. For example, when gold prices rise, it usually means global investors are seeking safe-haven assets (risk-off). This may put pressure on growth stocks
- Use alongside the Screener - after identifying strong sectors or markets through the Markets page, jump to the Screener to find specific counters within those sectors that have attractive technical setups
- Consistency beats depth - checking Markets for 5 minutes every day is better than spending 2 hours only on the weekend. The habit of consistently monitoring the market builds a "market feel" that cannot be learned from books
Frequently Asked Questions (FAQ)
Is the Mahersaham Markets page free?
Yes, the Markets page is open to all registered users without requiring a Gold subscription. You only need to sign up for a free account on mahersaham.com.
How often is the data on the Markets page updated?
Index and stock price data is updated periodically throughout trading hours. For Bursa Malaysia, data is updated during trading hours (9:00 AM to 5:00 PM). For US markets and crypto, data is updated according to their respective trading hours.
What is the difference between FBM KLCI and FBMEMAS?
The FBM KLCI contains the 30 largest companies on Bursa Malaysia by market capitalisation and serves as the primary market benchmark. FBMEMAS is broader, covering the KLCI 30 components plus 70 mid-cap stocks (FBM Mid 70), making it a more comprehensive index with 100 components.
Can I request charts for stocks in foreign markets?
Yes, the Chart Request function supports multiple markets including US stocks (NYSE, NASDAQ), global indices, commodities, forex and cryptocurrencies. You can switch between market tabs to select the instrument you want.
Why should I monitor the S&P 500 if I only invest in Bursa Malaysia?
Stock markets are globally interconnected. Major movements in the S&P 500 frequently influence sentiment on Bursa Malaysia the following day. Monitoring the S&P 500 helps you set early expectations and prepare before the local market opens.
What are Sector Indices and why are they important?
Sector Indices show the performance of each industry sector separately (e.g., Banking, Technology, Property). They are important because they allow you to identify which sectors are currently strong or weak, helping you focus your stock search on sectors that are receiving market attention.
How do I compare performance across different indices?
The easiest way is to compare the percentage change (%Chg) across indices. For example, if FBMSC is up 1.5% while the KLCI is only up 0.3%, this indicates small-cap stocks are outperforming and money is flowing into the small-cap segment.
Do I need to monitor all 8 market categories every day?
Not necessarily. Focus on the categories most relevant to your portfolio. If you only invest in Bursa Malaysia, Bursa Indices, Sector Indices and Commodities (especially CPO) are sufficient. Add US Indices if you also track US stocks.
Conclusion
The Markets page on mahersaham.com brings together all the market information you need in a single view - from Bursa Malaysia indices and KLCI components to the S&P 500, commodities and cryptocurrencies. Make it the first step in your daily analysis routine so every investment decision is made with clear market context.
Comfortable with the market overview? The next step is to own the stocks yourself.
Open a CDS account to start buying shares on Bursa Malaysia as well as international markets including the US and Hong Kong.
Just getting started? Download our free Stock Basics Ebook.
Open Markets now and track indices and global markets.