Mahersaham Portfolio: Monitor Your Stock Holdings in Real Time

What Is the Mahersaham Portfolio?
The Portfolio is a feature on mahersaham.com that lets you monitor your stock holdings in real time directly from your CDS account. It displays all the stocks you own along with essential data such as market value, profit and loss (P&L), percentage price changes, and Research Score - all on a single page.
Unlike the Watchlist, which simply stores a list of stocks you want to track, the Portfolio shows your actual holdings in your CDS account. This means the data displayed is accurate and reflects your real investment position at any given time.
With the Portfolio, you do not need to log into your broker platform separately to check your holdings. Everything can be viewed directly on mahersaham.com with a cleaner layout, customizable filters, and integrated Research Score analysis.
Who Can Use the Portfolio?
The Portfolio is an exclusive feature for users who have a CDS account through M+ (Malacca Securities). When you open a CDS account through the CDS account registration page on mahersaham.com, your account is automatically linked to the platform.
Once your CDS account is active and running, you can access the Portfolio by logging into mahersaham.com with the same account. The system reads your holdings data live from M+ and displays it in an easy-to-understand format.
If you have more than one CDS account under the same name, the Portfolio supports an aggregate view (combining all accounts) or you can choose to view a single account through the account selector dropdown at the top of the page.
Please note that this feature is only available for CDS accounts through M+. CDS accounts from other brokers are not supported at this time.
Main Portfolio Display
When you open the Portfolio page, you will see several key elements designed to make monitoring your stock holdings straightforward and efficient.
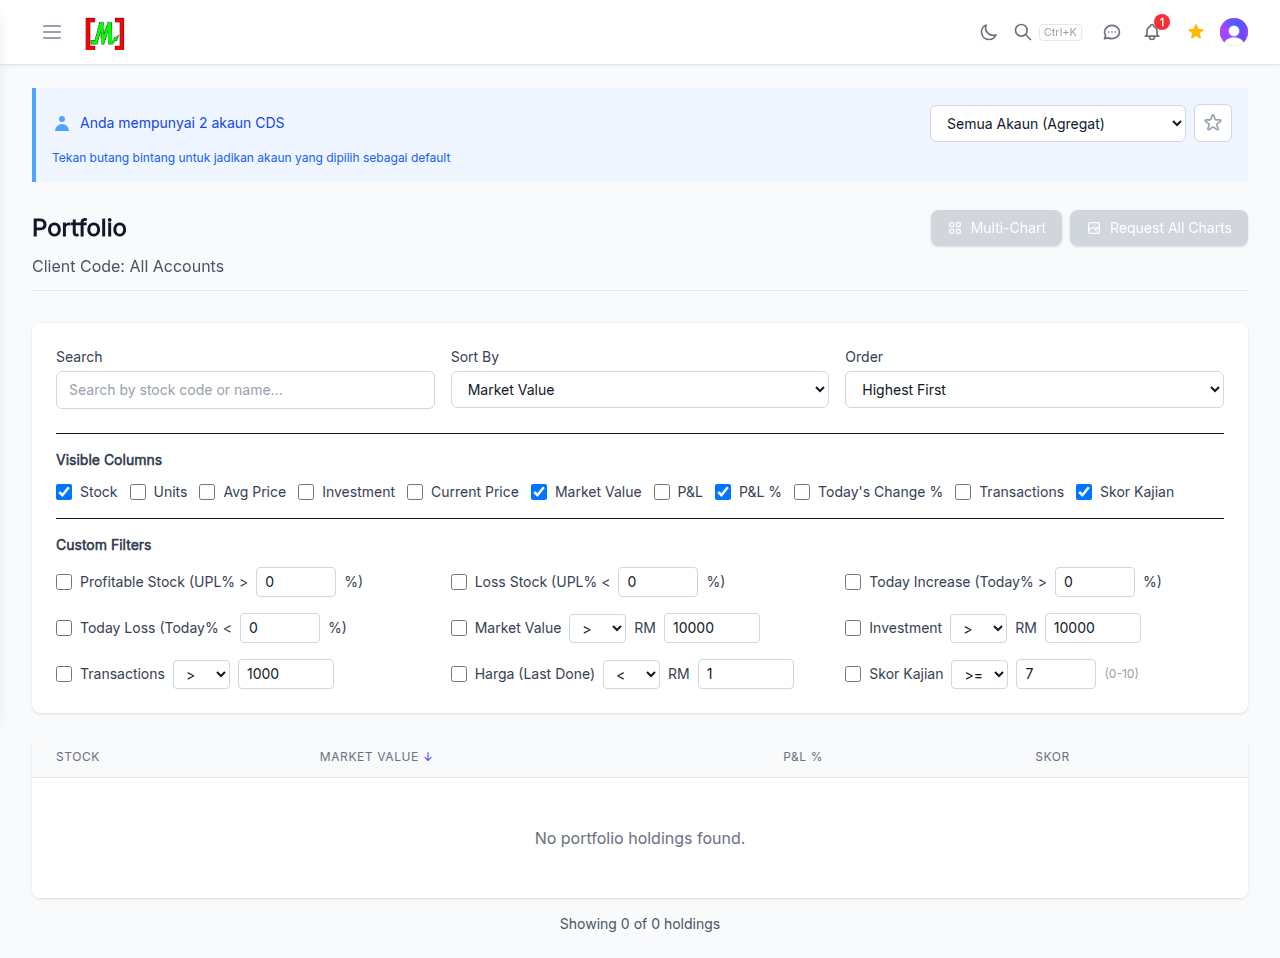
CDS Account Banner - At the top, a blue banner shows how many CDS accounts are linked. For example, "Anda mempunyai 2 akaun CDS" (You have 2 CDS accounts). You can choose to view all accounts in aggregate or select a specific account from the dropdown.
Star Button (Default Account) - Click the star icon to set the selected account as your default. This means every time you open the Portfolio, that default account will be displayed first.
Stock Search - The search box labeled "Search by stock code or name..." lets you find a specific stock within your portfolio. This is useful when you have many holdings and want to quickly check a particular counter.
Sort By and Order - You can sort your holdings by various criteria such as Market Value, P&L, and more. The order option lets you choose either "Highest First" or "Lowest First".
Multi-Chart and Request All Charts - Two purple buttons at the top that allow you to view technical charts for your holdings. These functions are explained in more detail further below.
Visible Columns - 11 Toggleable Data Columns
One of the key advantages of the mahersaham.com Portfolio is the ability to customize which columns are displayed. There are 11 columns that can be toggled on or off according to your needs:
- Stock - The stock code and company name. This is the basic column that is typically always displayed.
- Units - The number of units (lots) of shares you hold for each counter.
- Avg Price - Your average purchase price, calculated based on all purchase transactions made.
- Investment - Your original investment amount (Units x Avg Price). This shows how much money you have invested in that particular counter.
- Current Price - The current market price of the stock. This data is updated live during trading hours.
- Market Value - The current market value of your holdings (Units x Current Price). This shows what your holdings are worth at the current price.
- P&L - Profit and Loss in ringgit value (Market Value - Investment). A positive number means you are in profit, while a negative number means you are at a loss.
- P&L % - The percentage profit or loss compared to your original investment. This makes it easier to compare performance across counters with different investment sizes.
- Today's Change % - The percentage price change for the current day only. Useful for knowing which counters in your portfolio are moving actively on that trading day.
- Transactions - The number of transactions made for that counter. This gives an indication of how actively you have traded that particular stock.
- Skor Kajian (Research Score) - An analysis score generated by the Kajian Saham (Stock Research) system on mahersaham.com. This score evaluates company health based on various fundamental and technical metrics.
By default, the Stock, Market Value, P&L %, and Skor Kajian columns are checked. You can check additional columns or uncheck any column to customize the display according to what matters most to you.
For example, if you only want to focus on overall performance, display just Stock, Market Value, and P&L %. If you want a deeper analysis, add Avg Price, Investment, and Transactions.
Custom Filters - 9 Filters to Narrow Your Holdings
The Portfolio provides 9 custom filters that let you narrow down your holdings based on specific criteria. This is extremely useful when you have many holdings and want to focus on a particular category.
Here is the complete list of available custom filters:
- Profitable Stock (UPL% > 0) - Show only stocks that are currently in profit. UPL stands for Unrealised Profit/Loss - profit that has not been realised because you have not yet sold the shares.
- Loss Stock (UPL% < 0) - Show only stocks that are currently at a loss. Useful for identifying counters that need to be re-evaluated - whether to cut loss or continue holding.
- Today Increase (Today% > 0) - Show stocks whose prices increased today. Useful for seeing which counters in your portfolio are gaining strength on the current trading day.
- Today Loss (Today% < 0) - Show stocks whose prices declined today.
- Market Value (> RM 10,000) - Show only holdings with a market value exceeding RM10,000. This helps you focus on larger positions that have a significant impact on your overall portfolio.
- Investment (> RM 10,000) - Filter based on original investment amount exceeding RM10,000.
- Transactions (> 1,000) - Show counters with more than 1,000 transactions. This highlights the most actively traded counters in your portfolio.
- Harga Last Done (< RM 1) - Show stocks priced below RM1 (penny stocks). Useful if you want to review low-priced holdings separately.
- Skor Kajian (>= 7) - Show only stocks with a Research Score of 7 or higher. This highlights counters in your portfolio with strong fundamental and technical foundations based on the mahersaham scoring system.
You can activate more than one filter simultaneously. For example, you can filter for "Profitable Stock" and "Skor Kajian >= 7" at the same time to see only holdings that are currently profitable AND have a high research score.
Multi-Chart and Request All Charts
The two purple buttons at the top of the Portfolio provide quick access to technical charts for all your holdings.
Multi-Chart - Displays price charts for multiple counters simultaneously in a single view. This allows you to visually compare price movements without having to open each counter individually. This function is particularly useful for identifying patterns or trends occurring across your portfolio.
Request All Charts - Requests the system to generate charts for all holdings in your portfolio. After pressing this button, the system will process and prepare technical charts for every counter you hold. It takes a short while depending on the number of holdings you have.
Both functions help investors who practice technical analysis to assess the current position of their holdings. You can see whether a counter is at a support zone, resistance level, or forming a particular chart pattern.
Tips for Using the Portfolio Effectively
- Check your Portfolio at least once a week - Even though data is updated live, you do not need to monitor it every minute. A weekly review is sufficient for medium and long-term investors. Day traders can check more frequently.
- Use Custom Filters for quick decisions - If your portfolio is large, use the "Loss Stock" filter to identify counters that need immediate attention, or "Skor Kajian >= 7" to confirm holdings that remain fundamentally strong.
- Compare P&L % across counters - Do not only look at P&L in ringgit. Percentage gives a fairer picture because it accounts for different investment sizes. The counter with the highest P&L% may not be the largest in ringgit terms, but it is the most capital-efficient.
- Combine with Research Score - If a counter in your portfolio has a low Research Score (below 5), it may need re-evaluation. Open the Stock Research page for in-depth analysis.
- Use the aggregate view - If you have more than one CDS account, use the "Semua Akaun (Agregat)" view to see your combined portfolio overview. This helps you understand the true diversification of your investments.
- Sort by context - Use "Sort by Market Value" to know your largest holdings. Use "Sort by P&L %" to find your most profitable positions. Use "Sort by Today's Change" to see what is moving today.
Frequently Asked Questions (FAQ)
Is the Portfolio free to use?
The Portfolio is a feature included for users who have a CDS account through M+ (Malacca Securities). As long as your CDS account is active, you can access the Portfolio on mahersaham.com.
Is the portfolio data updated in real time?
Yes. Holdings data, current prices, market value, and P&L are updated live during Bursa Malaysia trading hours (9 AM to 5 PM, Monday to Friday).
Can I view more than one CDS account?
Yes. The Portfolio supports viewing multiple CDS accounts. You can select "Semua Akaun (Agregat)" to view a combined view of all accounts, or choose a specific account through the dropdown at the top.
What is the Research Score (Skor Kajian) in the Portfolio?
The Research Score is a rating generated by the Kajian Saham system on mahersaham.com. It evaluates company health based on fundamental and technical metrics. A higher score indicates stronger fundamentals. Learn more on the Stock Research page.
Why does my portfolio show as empty?
If the display shows "No portfolio holdings found", it means your CDS account does not yet have any stock holdings, or your CDS account has not been linked. Make sure you are logged in with the same account used for your CDS registration.
Can I access the Portfolio on my mobile phone?
Yes. mahersaham.com is a responsive web platform. The Portfolio can be accessed through the browser on your mobile phone, tablet, or computer without needing to install any application.
Conclusion
The Mahersaham Portfolio provides a comprehensive live view of your stock holdings. With 11 customizable columns, 9 custom filters, and Multi-Chart functionality, it is a thorough monitoring tool for Bursa Malaysia investors. Combine it with the Screener, Watchlist, and Stock Research for a more systematic investment workflow.
Open a CDS account to start investing in Bursa Malaysia as well as international stocks such as US and Hong Kong through the CDS account registration page.
Download the free stock investing basics ebook at the free ebook page.
Open Portfolio now and monitor your stock holdings in real time.