The World's 30 Largest Economies: Where Does Malaysia Really Stand?

In July 2023, Prime Minister and Finance Minister Datuk Seri Anwar Ibrahim announced a clear target: Malaysia wants to be among the world's 30 largest economies by 2033, up from 37th place at the time.
Three years on, where does Malaysia actually stand? And is that target realistic, or just rhetoric?
This article breaks down three things. First, which list you should actually be referencing, because the answer changes depending on the source. Second, the real strengths and weaknesses of each of the 30 largest economies. Third, an honest calculation of whether Malaysia can break into that group, based on the International Monetary Fund's (IMF) own projections.
The Quick Answer
According to the IMF World Economic Outlook, April 2026 edition, Malaysia ranks 35th in the world with a nominal GDP of US$516 billion in 2026. The United States remains first (US$32.4 trillion), followed by China (US$20.9 trillion) and Germany (US$5.45 trillion).
To break into the top 30, Malaysia needs to clear a threshold of roughly US$622 billion this year. The gap is US$106 billion. The problem is that the threshold keeps rising too. The detailed maths is at the end of this article.
Which List Should You Actually Reference?
This is the single most common source of confusion. You might read that Malaysia is 35th, 36th, or 37th in three different articles published in the same week. All of them can be correct, because they come from different lists.
There are three internationally recognised sources:
- IMF (World Economic Outlook) - updated twice a year, in April and October. It includes current-year estimates plus projections up to five years ahead. This is the reference financial media use most often because it is the most current.
- World Bank (World Development Indicators) - reports only actual data from the previous year, with no projections. More conservative, but always one to two years behind. Malaysia's government target uses this basis.
- United Nations (UN Statistics Division) - the slowest to update, but covers the largest number of countries.
The second difference matters even more: the measurement method. Nominal GDP converts every economy into US dollars at market exchange rates. Purchasing power parity (PPP) GDP adjusts for local cost of living.
The difference is not small. Malaysia ranks 35th on a nominal basis, but 28th on PPP at US$1.61 trillion. In other words, by the PPP measure, Malaysia is already inside the world's top 30.
So which is right? Both. Nominal is better for assessing international purchasing power, export market size, and the ability to service foreign debt. PPP is better for assessing the actual living standards of a country's people. If you are not yet familiar with how these are calculated, we cover it in detail in What Is GDP (KDNK).
For this article we use nominal GDP from the IMF WEO April 2026, because that is the basis people mean when they talk about "the 30 largest economies in the world".
The 30 Largest Economies in the World
Global GDP is projected to reach US$126.3 trillion in 2026. The top ten economies alone account for more than half of that, while the United States on its own represents roughly a quarter of the global economy.
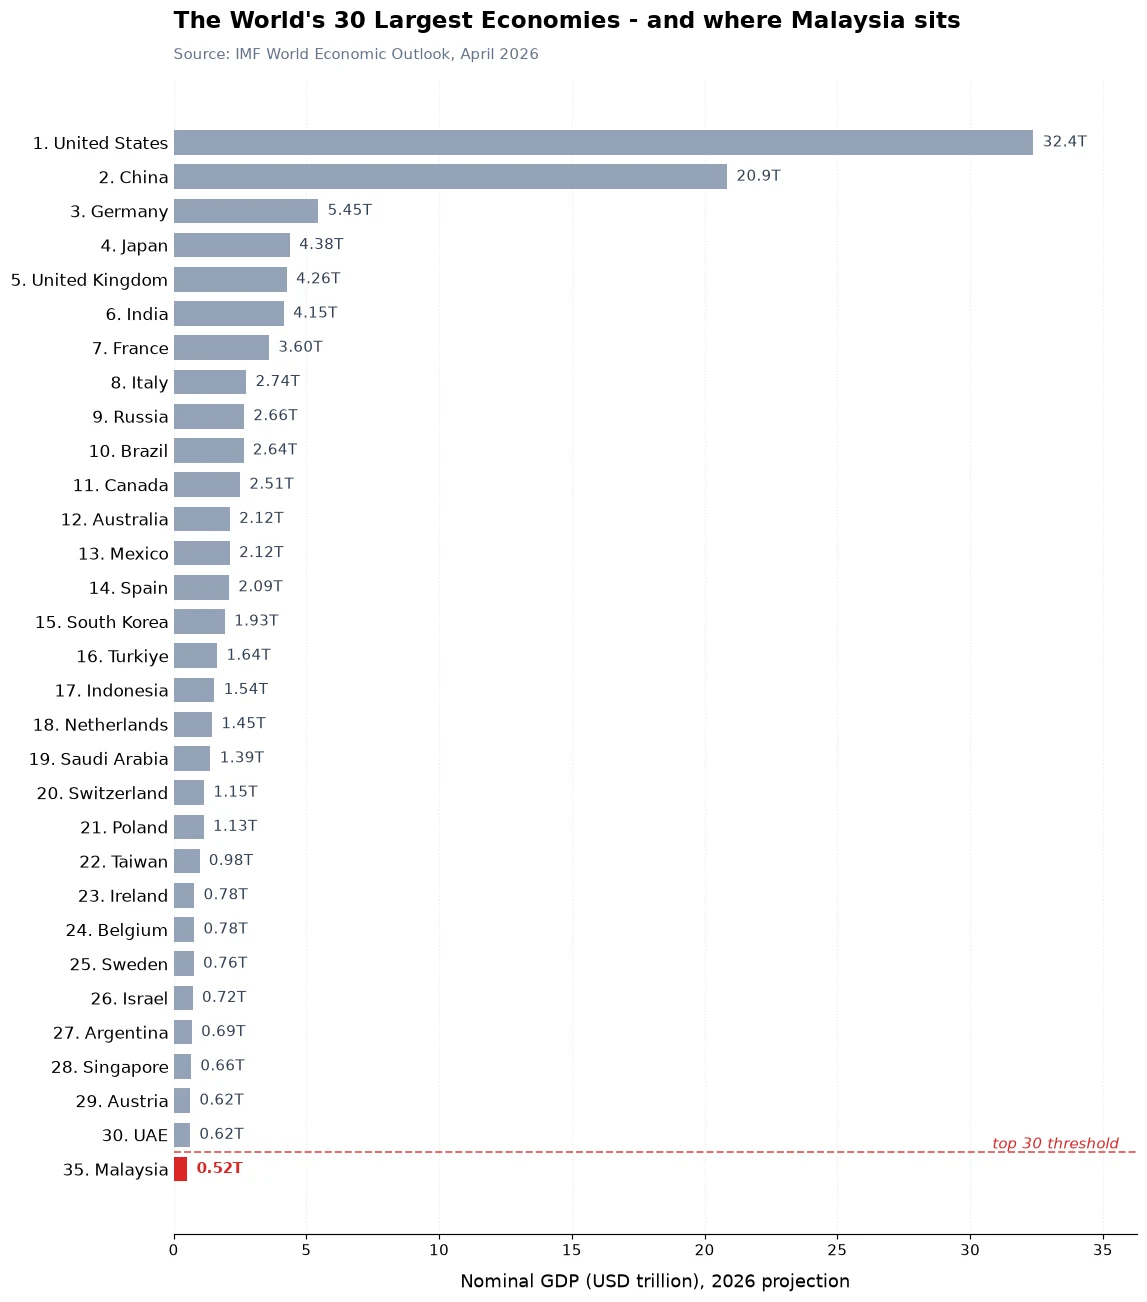
Here is the full list, with GDP per capita and projected real growth for 2026:
| # | Country | GDP (US$ billion) | Per capita (US$) | 2026 growth |
|---|---|---|---|---|
| 1 | United States | 32,384 | 94,430 | 2.3% |
| 2 | China | 20,852 | 14,874 | 4.4% |
| 3 | Germany | 5,453 | 65,303 | 0.8% |
| 4 | Japan | 4,379 | 35,703 | 0.7% |
| 5 | United Kingdom | 4,265 | 61,056 | 0.8% |
| 6 | India | 4,153 | 2,813 | 6.5% |
| 7 | France | 3,596 | 52,083 | 0.9% |
| 8 | Italy | 2,738 | 46,505 | 0.5% |
| 9 | Russia | 2,656 | 18,525 | 1.1% |
| 10 | Brazil | 2,636 | 12,313 | 1.9% |
| 11 | Canada | 2,507 | 60,305 | 1.5% |
| 12 | Australia | 2,124 | 75,648 | 2.0% |
| 13 | Mexico | 2,121 | 15,779 | 1.6% |
| 14 | Spain | 2,091 | 41,563 | 2.1% |
| 15 | South Korea | 1,931 | 37,412 | 1.9% |
| 16 | Turkiye | 1,640 | 19,018 | 3.4% |
| 17 | Indonesia | 1,540 | 5,362 | 5.0% |
| 18 | Netherlands | 1,450 | 79,918 | 1.2% |
| 19 | Saudi Arabia | 1,389 | 37,811 | 3.1% |
| 20 | Switzerland | 1,147 | 126,177 | 1.3% |
| 21 | Poland | 1,134 | 31,336 | 3.3% |
| 22 | Taiwan | 977 | 42,103 | 5.2% |
| 23 | Ireland | 779 | 140,186 | 2.5% |
| 24 | Belgium | 777 | 65,112 | 0.7% |
| 25 | Sweden | 760 | 70,676 | 2.0% |
| 26 | Israel | 720 | 69,804 | 3.5% |
| 27 | Argentina | 688 | 14,357 | 3.5% |
| 28 | Singapore | 660 | 107,758 | 3.5% |
| 29 | Austria | 624 | 67,761 | 0.7% |
| 30 | United Arab Emirates | 622 | 54,214 | 3.1% |
| ... Norway (31), Thailand (32), Colombia (33), Vietnam (34) ... | ||||
| 35 | Malaysia | 516 | 15,085 | 4.7% |
Notice an important pattern here. The countries with the biggest economies are not necessarily the ones with the wealthiest citizens, nor the fastest growing. India ranks 6th but its GDP per capita is only US$2,813, less than a fifth of Malaysia's. Switzerland ranks 20th with a per capita figure of US$126,177.
The Two Giants: United States and China
1. United States (US$32.4 trillion)
Strengths: Unmatched dominance in technology and finance. The US dollar is the world's reserve currency, giving America the privilege of borrowing in its own currency. The deepest capital markets in the world, plus an innovation ecosystem and research universities without equal. Demographics are also healthier than Europe's or Japan's thanks to immigration.
Weaknesses: General government debt has reached 125.8 percent of GDP and continues climbing. Persistent fiscal deficits even when the economy is strong. High income inequality, a costly healthcare system, and political polarisation that makes long-term reform difficult. We discuss the implications of that debt load further in US National Debt Hits $36.5 Trillion.
2. China (US$20.9 trillion)
Strengths: The world's factory, with the most complete manufacturing supply chain on the planet. A global leader in electric vehicles, batteries, solar, and rare earth materials. A domestic market of 1.4 billion people, and the ability to plan long term without electoral cycles.
Weaknesses: A property sector crisis that is not fully resolved, deflationary pressure, and high local government debt. The population has begun shrinking, a structural problem that is difficult to reverse. Trade tensions with the West also restrict access to advanced chip technology. We cover how China is responding in China's Strategy to Dominate Global Trade.
Mature Advanced Economies: Wealthy but Slow
This group is rich, stable, and institutionally strong. They share the same problem: ageing populations, flat productivity, and growth that rarely exceeds 2 percent.
3. Germany (US$5.45 trillion)
Strengths: Europe's best manufacturing and engineering base, the healthiest debt position among G7 nations at 64.6 percent of GDP, and a large current account surplus. Its Mittelstand of specialised mid-sized firms dominates global niches.
Weaknesses: Growth has nearly stalled at 0.8 percent. High energy costs since losing Russian gas have hurt heavy industry. Overdependence on automotive exports now being challenged by Chinese EV makers. Bureaucracy and lagging digitalisation.
4. Japan (US$4.38 trillion)
Strengths: High-technology expertise in robotics, precision machinery, and automotive components. The world's largest net creditor, meaning its overseas assets far exceed its external debt. Social stability and trusted corporate brands.
Weaknesses: Government debt at 204.4 percent of GDP, the highest among major economies. The most severe ageing problem in the world and a shrinking workforce. Growth of 0.7 percent, and yen weakness that shrinks its economy in dollar terms.
5. United Kingdom (US$4.27 trillion)
Strengths: London remains a global financial centre, with strength in professional services, law, pharmaceuticals, and higher education. Language and legal system attract international capital.
Weaknesses: Productivity has been flat since the 2008 financial crisis. Trade friction with its largest market following Brexit. Debt at 103.6 percent of GDP, a persistent current account deficit, and growth of just 0.8 percent.
7. France (US$3.60 trillion)
Strengths: Europe's most diversified economy, strong in aerospace, nuclear power, pharmaceuticals, luxury goods, and tourism. Cheap, low-carbon electricity from its nuclear fleet.
Weaknesses: Debt at 118.4 percent of GDP and a fiscal deficit that is hard to control. Public spending is among the highest in the world relative to economy size. Rigid labour markets and political resistance to reform.
8. Italy (US$2.74 trillion)
Strengths: Europe's second-largest manufacturing base after Germany, particularly in industrial machinery, fashion, and premium food. High household savings rates.
Weaknesses: Growth of 0.5 percent, the weakest on this list. Debt at 138.4 percent of GDP. A rapidly ageing population, a wide north-south economic divide, and a slow legal system.
11. Canada (US$2.51 trillion)
Strengths: Natural resource wealth in oil, gas, timber, and minerals. Strong institutions, a banking system proven resilient through crises, and immigration policy that adds to the workforce.
Weaknesses: Overreliance on a single customer, the United States, which absorbs roughly three-quarters of its exports. Household debt among the highest in the world and an expensive housing market. Labour productivity lags its southern neighbour.
12. Australia (US$2.12 trillion)
Strengths: A major exporter of iron ore, coal, and liquefied natural gas. One of the healthiest debt positions at 50.6 percent of GDP. Its superannuation retirement system channels large domestic capital into markets.
Weaknesses: Exposed to commodity cycles and Chinese demand. Housing costs are extreme relative to incomes. A small manufacturing sector leaves the economy less diversified.
14. Spain (US$2.09 trillion)
Strengths: Growth of 2.1 percent, among the fastest in the eurozone. World-class tourism, rapidly expanding renewable energy, and strong trade links with Latin America.
Weaknesses: Structurally high unemployment, particularly among young people. Debt at 98.2 percent of GDP. Overreliance on cyclical tourism and property.
15. South Korea (US$1.93 trillion)
Strengths: A global leader in semiconductors, consumer electronics, shipbuilding, and automotive. Research and development spending among the highest in the world relative to GDP. Cultural influence that reinforces its export brands.
Weaknesses: The world's lowest birth rate, a serious long-term threat. Chaebol dominance that limits competition. Exposure to chip cycles and peninsular geopolitical tension.
Emerging Powers: Fast Growth, Higher Risk
6. India (US$4.15 trillion)
Strengths: The fastest-growing major economy in the world at 6.5 percent. Young demographics with a population of 1.48 billion. Strength in IT services, generic pharmaceuticals, and a expanding domestic market.
Weaknesses: GDP per capita of just US$2,813 shows the wealth has not reached most citizens. Infrastructure and bureaucracy remain obstacles. Manufacturing stays small relative to the size of the economy.
9. Russia (US$2.66 trillion)
Strengths: Vast energy, mineral, and agricultural land reserves. Government debt at just 19.1 percent of GDP, the lowest on this list. The ability to redirect energy exports to Asia.
Weaknesses: International sanctions restricting access to Western technology and capital markets. An economy increasingly dependent on military spending. Skilled workforce emigration and little diversification beyond resources.
10. Brazil (US$2.64 trillion)
Strengths: An agricultural superpower in soy, beef, and coffee. Mineral wealth, hydropower, and offshore oil discoveries. A domestic market of 214 million.
Weaknesses: Historically high interest rates and debt at 96.5 percent of GDP. Deep social inequality, crime, and policy instability. Growth of only 1.9 percent despite its resource wealth.
13. Mexico (US$2.12 trillion)
Strengths: A primary beneficiary of the nearshoring trend as companies move production closer to the American market. The USMCA trade agreement and competitive labour costs.
Weaknesses: Almost entirely dependent on US demand and exposed to shifts in tariff policy. Security and governance problems. Energy investment constrained by government policy.
16. Turkiye (US$1.64 trillion)
Strengths: Strategic geography between Europe and Asia. A diversified manufacturing base spanning textiles, automotive, and defence. Low government debt at 25.5 percent of GDP and growth of 3.4 percent.
Weaknesses: A history of very high inflation and repeated lira depreciation. Inconsistent monetary policy that undermines foreign investor confidence. A persistent current account deficit.
17. Indonesia (US$1.54 trillion)
Strengths: Southeast Asia's largest economy with 287 million people and growth of 5.0 percent. The world's largest nickel producer, a critical commodity for EV batteries. Low government debt at 41.5 percent of GDP.
Weaknesses: GDP per capita of US$5,362 remains low. Expensive inter-island infrastructure and logistics. Dependence on raw commodity exports, and governance concerns that have recently weighed on foreign investor sentiment.
27. Argentina (US$688 billion)
Strengths: Extensive agricultural resources, plus large lithium reserves and the Vaca Muerta shale gas field. Growth of 3.5 percent following a fiscal reform programme.
Weaknesses: A long history of hyperinflation, capital controls, and repeated debt defaults. Fragile investor confidence and thin foreign currency reserves.
Small but Very Wealthy Economies
This group proves an important point: population size does not determine wealth. All of them have fewer than 25 million people, yet all sit in the world's top 30.
18. Netherlands (US$1.45 trillion)
Strengths: The Port of Rotterdam as Europe's logistics gateway. The world's second-largest agricultural exporter despite its small size. Strong in semiconductor equipment and energy.
Weaknesses: A highly open economy, very sensitive to global trade slowdowns. Environmental and land constraints. High household debt.
20. Switzerland (US$1.15 trillion)
Strengths: GDP per capita of US$126,177. World-class private banking, pharmaceuticals, and precision machinery. Political stability and a franc that acts as a safe haven for capital.
Weaknesses: A strong franc hurts exporter competitiveness. Living and operating costs among the highest in the world. A domestic market that is simply too small.
22. Taiwan (US$977 billion)
Strengths: Dominates advanced semiconductor manufacturing, giving it strategic importance far beyond its economic size. Growth of 5.2 percent driven by artificial intelligence chip demand. Low debt at 27.6 percent of GDP.
Weaknesses: Significant geopolitical risk. Excessive concentration in a single industry. Power and water shortages for resource-hungry chip fabrication plants.
23. Ireland (US$779 billion)
Strengths: The European hub for American technology and pharmaceutical firms. Low corporate tax, an English-speaking workforce, and EU single market access.
Weaknesses: That per capita figure of US$140,186 is misleading, inflated by multinational profits booked in Ireland but not enjoyed by local residents. Overreliance on a handful of foreign firms and exposure to global tax rule changes.
24. Belgium (US$777 billion)
Strengths: Home to EU institutions and a European logistics hub. Strong chemicals and pharmaceuticals industries.
Weaknesses: Debt at 109.2 percent of GDP and growth of just 0.7 percent. One of the heaviest tax burdens in the world and a complex governance structure.
25. Sweden (US$760 billion)
Strengths: An innovation culture that produces global companies well beyond what its size would suggest. Low debt at 36.7 percent of GDP, with strength in engineering, telecommunications, and clean technology.
Weaknesses: A property market sensitive to interest rates and high household debt. A small economy dependent on exports.
26. Israel (US$720 billion)
Strengths: The highest density of technology startups in the world, with strength in cybersecurity and defence. Growth of 3.5 percent and offshore natural gas discoveries.
Weaknesses: Ongoing regional security risk and its effect on investment. High living costs and a productivity gap between the technology sector and the rest of the economy.
28. Singapore (US$660 billion)
Strengths: A regional financial, shipping, and refining hub. GDP per capita of US$107,758 with only 6.1 million people. Efficient governance and large national reserves.
Weaknesses: The debt figure of 171.9 percent of GDP looks alarming, but needs to be understood correctly. Singapore government securities are issued to invest retirement savings, not to finance deficits, and the country is actually in a net creditor position. Its real challenges are land size, reliance on foreign labour, and full exposure to global trade cycles.
29. Austria (US$624 billion)
Strengths: Specialised manufacturing, tourism, and a strategic position as a gateway to Central and Eastern Europe.
Weaknesses: Growth of 0.7 percent, debt at 82.1 percent of GDP, and heavy exposure to a slowing German economy as its main trading partner.
Resource-Based Economies and Regional Powers
19. Saudi Arabia (US$1.39 trillion)
Strengths: The largest and lowest-cost oil reserves in the world. Low debt at 32.1 percent of GDP and a large sovereign wealth fund to finance the Vision 2030 diversification programme.
Weaknesses: Government revenue still depends heavily on oil prices. The global energy transition threatens its long-term business model. A labour market still undergoing reform.
30. United Arab Emirates (US$622 billion)
Strengths: More advanced diversification than its Gulf neighbours, with Dubai as a trade, aviation, tourism, and finance hub. Low debt at 31.4 percent of GDP and a business-friendly environment that attracts capital and foreign talent.
Weaknesses: Still exposed to oil cycles and regional geopolitical tension. A cyclical property market and heavy reliance on expatriate labour.
21. Poland (US$1.13 trillion)
Strengths: Europe's best growth story of the past three decades, now expanding at 3.3 percent. A beneficiary of production shifting from Asia to Eastern Europe, with competitive labour costs and EU single market access.
Weaknesses: Exposed to regional security risk because of its location. A shrinking population from emigration and low birth rates. Heavy dependence on German demand.
Malaysia's Outlook: Where We Actually Stand
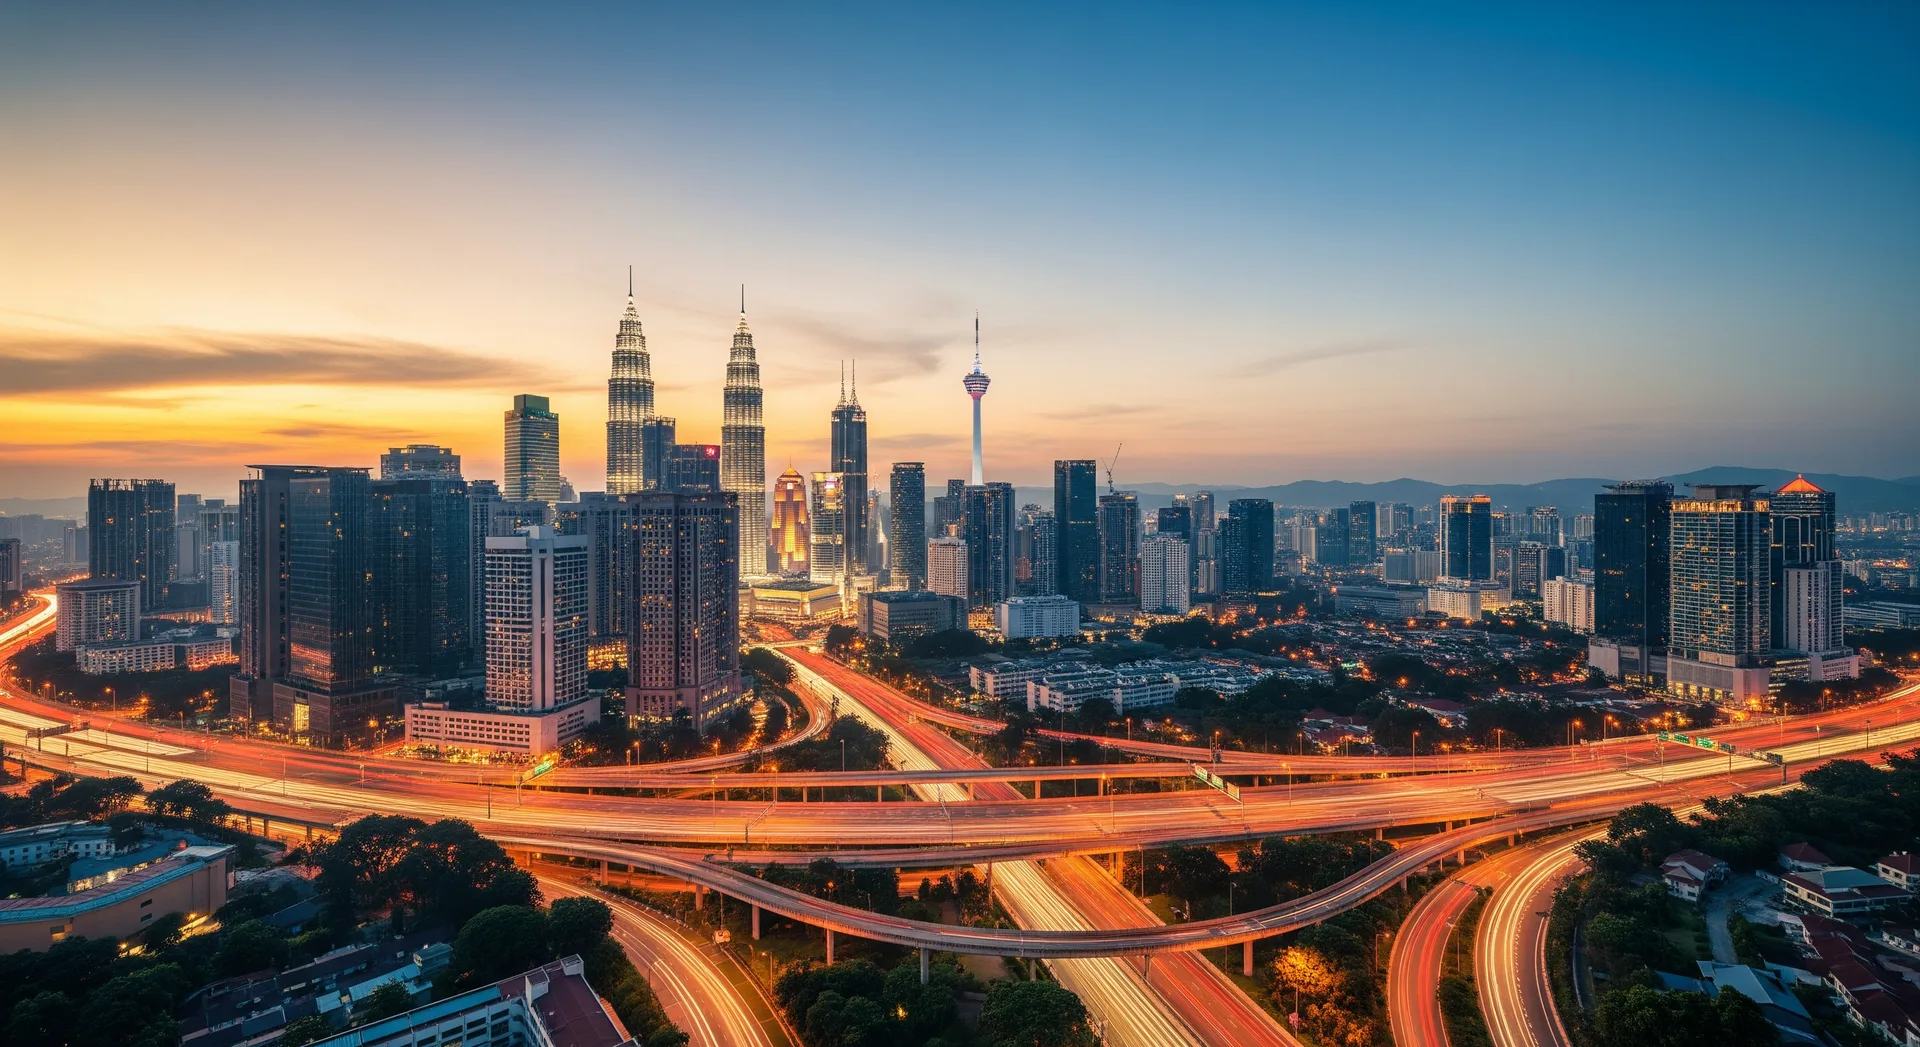
The good news is that Malaysia is moving in the right direction. The country climbed from 37th in 2024 to 35th in 2025 and held that position in 2026. Nominal GDP jumped from US$422 billion in 2024 to US$516 billion in 2026, a 22 percent increase in two years.
The underlying performance is solid too. Real GDP grew 5.4 percent in the first quarter of 2026 and 5.8 percent in the second, beating analyst expectations. The IMF has revised Malaysia's 2026 growth forecast up to 4.7 percent, above the official 4.0 to 5.0 percent range set by Bank Negara Malaysia. Official quarterly data can be checked on the OpenDOSM portal.
The drivers are reasonably diversified: strong domestic demand, data centre and electrical and electronics investment, and Visit Malaysia Year 2026. A full analysis of that growth composition is in Malaysia GDP 2026.
But there is one thing that needs to be understood. The rise in ranking is not purely because the economy is growing fast. A large part of it comes from somewhere else, which is what we turn to next.
The Ringgit Factor: The Variable Most People Miss
Position on this list is measured in US dollars. Which means there are two ways to climb: grow your economy, or strengthen your currency.
Malaysia has benefited from both since 2024. The ringgit has been one of Asia's best-performing currencies, strengthening to around RM3.99 against the US dollar by mid-2026, an appreciation of nearly 7 percent over a year. Further reading on that rally is in Ringgit Best Performer in Asia.
The effect is substantial. If Malaysia's GDP in ringgit stayed exactly the same but the ringgit strengthened 10 percent, our GDP in US dollars would rise 10 percent automatically, and our ranking could jump several places without any change in the real economy.
This is a double-edged sword. It means our 35th place today is partly borrowed from ringgit strength, and it can reverse if the ringgit weakens again. It is also why Japan has slipped down the rankings in recent years despite its economy not contracting, because the yen weakened significantly.
Can Malaysia Reach the Top 30 by 2033?
Now let us do the honest maths, using the IMF's own projections.
In 2026, the threshold for entering the top 30 is US$622 billion, the position held by the United Arab Emirates. Malaysia stands at US$516 billion. The gap is US$106 billion.
The problem is that the threshold is a moving target. Here is what the IMF projections show:
| Year | Malaysia rank | Malaysia GDP | Top 30 threshold | Gap |
|---|---|---|---|---|
| 2024 | 37th | US$422b | US$535b | US$112b |
| 2026 | 35th | US$516b | US$622b | US$106b |
| 2028 | 35th | US$591b | US$664b | US$73b |
| 2030 | 33rd | US$672b | US$716b | US$43b |
| 2031 | 33rd | US$716b | US$778b | US$61b |
The gap narrows, but it does not close. By 2031, the final year of IMF projections, Malaysia is expected to reach 33rd place, still three places short of the target. Ahead of us at that point are the Philippines, Bangladesh, and Austria, while Vietnam closes in from behind.
To genuinely reach 30th place by 2033, Malaysia would need to grow roughly 9.8 percent a year in dollar terms between 2031 and 2033. Compare that with the IMF's own projection for Malaysia of around 6.6 percent a year in nominal dollar terms.
So the honest answer is this: on current projections, the target will not be reached automatically. It requires one of three things.
- Faster real growth - the government's own target is 5.5 to 6.0 percent a year, well above the IMF's assumption of 4.3 percent after 2028. The first two quarters of 2026 suggest it is not impossible.
- A continuously strengthening ringgit - every 10 percent of ringgit appreciation adds roughly US$70 billion to our nominal GDP at current levels.
- Competitor weakness - rankings are relative. If the countries ahead of us stumble, we rise without doing anything.
It is also worth remembering that the government's original target uses World Bank data as its basis, not the IMF. Rankings can differ by one or two places between the two sources. And as noted earlier, by the PPP measure Malaysia is already 28th.
What This Means for Bursa Malaysia Investors
This list is not just interesting reading. There are several practical takeaways.
First, economy size is not an indicator of stock market returns. Japan is the fourth-largest economy but its stock market took more than three decades to recover to its 1989 level. Taiwan, meanwhile, ranks only 22nd yet offers exposure to the global semiconductor industry. Do not equate a large GDP with a good investment opportunity.
Second, understand who your companies' customers are. Malaysia is an open economy. When you own shares in an electrical and electronics manufacturer or a glove maker on Bursa Malaysia, that company's performance depends on the health of the United States, China, and Europe, not just Malaysia's economy. This list of 30 is essentially a list of our end customers.
Third, ringgit strength affects sectors differently. A strong ringgit reduces exporters' earnings when converted back, but helps companies importing raw materials or carrying dollar-denominated debt. It also tends to attract foreign fund inflows into capital markets.
Fourth, a rising ranking usually attracts institutional attention. Larger and more stable economies tend to receive higher weightings in emerging market indices, which in turn brings passive fund flows.
It should be stressed that all of this is a framework for understanding macro context, not a signal to buy or sell any particular stock. Investment decisions should be based on your own research into the companies concerned.
FAQ
Where does Malaysia rank in the world economy?
Based on IMF World Economic Outlook April 2026 data, Malaysia ranks 35th in the world with a nominal GDP of US$516 billion. On a purchasing power parity (PPP) basis, Malaysia ranks higher at 28th, with a value of US$1.61 trillion.
What is the difference between nominal GDP and PPP GDP?
Nominal GDP converts every economy into US dollars at current market exchange rates. PPP GDP adjusts for local cost of living, so countries with lower living costs appear larger. Nominal is better for assessing international purchasing power, while PPP is better for assessing living standards.
Can Malaysia reach the top 30 largest economies by 2033?
Based on current IMF projections, Malaysia is expected to reach 33rd place by 2031, still short of the target. To reach 30th, Malaysia would need growth faster than the IMF projects, or sustained ringgit appreciation, or a combination of both.
Why does Malaysia's ranking differ between articles?
Because of different sources and data years. The IMF, World Bank, and United Nations each publish their own lists on different update schedules. World Bank data typically lags the IMF by one to two years. Always check the source and reference year before comparing figures.
Which country is growing fastest among the top 30?
Among the 30 largest economies, India records the highest real growth at 6.5 percent for 2026, followed by Taiwan at 5.2 percent and Indonesia at 5.0 percent. Malaysia at 4.7 percent is actually growing faster than most countries in that top 30 list.
Why does a stronger ringgit raise Malaysia's ranking?
Because rankings are measured in US dollars. If Malaysia's economy does not change at all in ringgit terms but the ringgit strengthens 10 percent against the dollar, our GDP in dollars rises 10 percent and the ranking can jump. It also means the ranking can fall back if the ringgit weakens.
Does a bigger economy mean a better stock market?
Not necessarily. GDP size and stock market returns are two different things. Japan is the classic example, the world's fourth-largest economy yet its stock index took more than three decades to recover to its 1989 peak. Industry structure, valuation, and corporate governance matter far more than economy size alone.
Where can I find the latest country GDP data?
The most current source is the IMF World Economic Outlook database, updated every April and October. For Malaysia specifically, refer to the official OpenDOSM portal from the Department of Statistics Malaysia, updated quarterly.
Conclusion
Malaysia sits 35th in the world today, five places away from the government's official target. IMF projections suggest we will reach 33rd by 2031, real progress but not yet enough to break into the top 30 by 2033 without faster growth or a stronger ringgit.
For investors, the biggest lesson is not about the ranking number itself. It is about understanding that Malaysia's economy is tightly linked to the health of these 30 largest economies, because they are the end buyers of what Bursa Malaysia-listed companies produce.
If you want to take the next step from understanding the economy to investing in it, the first step is having an account to trade with.
A CDS trading account lets you invest on Bursa Malaysia as well as overseas markets such as the United States and Hong Kong. Open a CDS account here.
To understand the fundamentals of stock investing from the ground up, download our free ebook covering a step-by-step guide for new investors. Get the free Stock Market Basics Ebook here.
Further Reading
- What Is GDP (KDNK)? Calculation, Facts & Malaysia's Global Ranking
- Malaysia GDP Hits 5.2% in 2025 - 2026 Forecast, Key Sectors & Investment Opportunities
- GDP 5.8%, Inflation 1.9% - Why Malaysia's Economic Fundamentals Remain Resilient
- Ringgit 'Best Performer' in Asia: The RM3.96 Surge & Risks Ahead
- US National Debt Hits $36.5 Trillion: What It Means for the Global Economy