Momentum Investing: Why Stocks That Rise Tend to Keep Rising

What Is Momentum Investing?
Momentum investing is a strategy that buys stocks that are rising and sells stocks that are falling. The principle is simple: stocks that have already risen tend to keep rising, and stocks that have already fallen tend to keep falling - at least in the short to medium term (3-12 months).
Unlike contrarian investing which buys when others are fearful, momentum investing follows the market's direction. You are not fighting the trend - you are riding it like a surfer riding a wave.
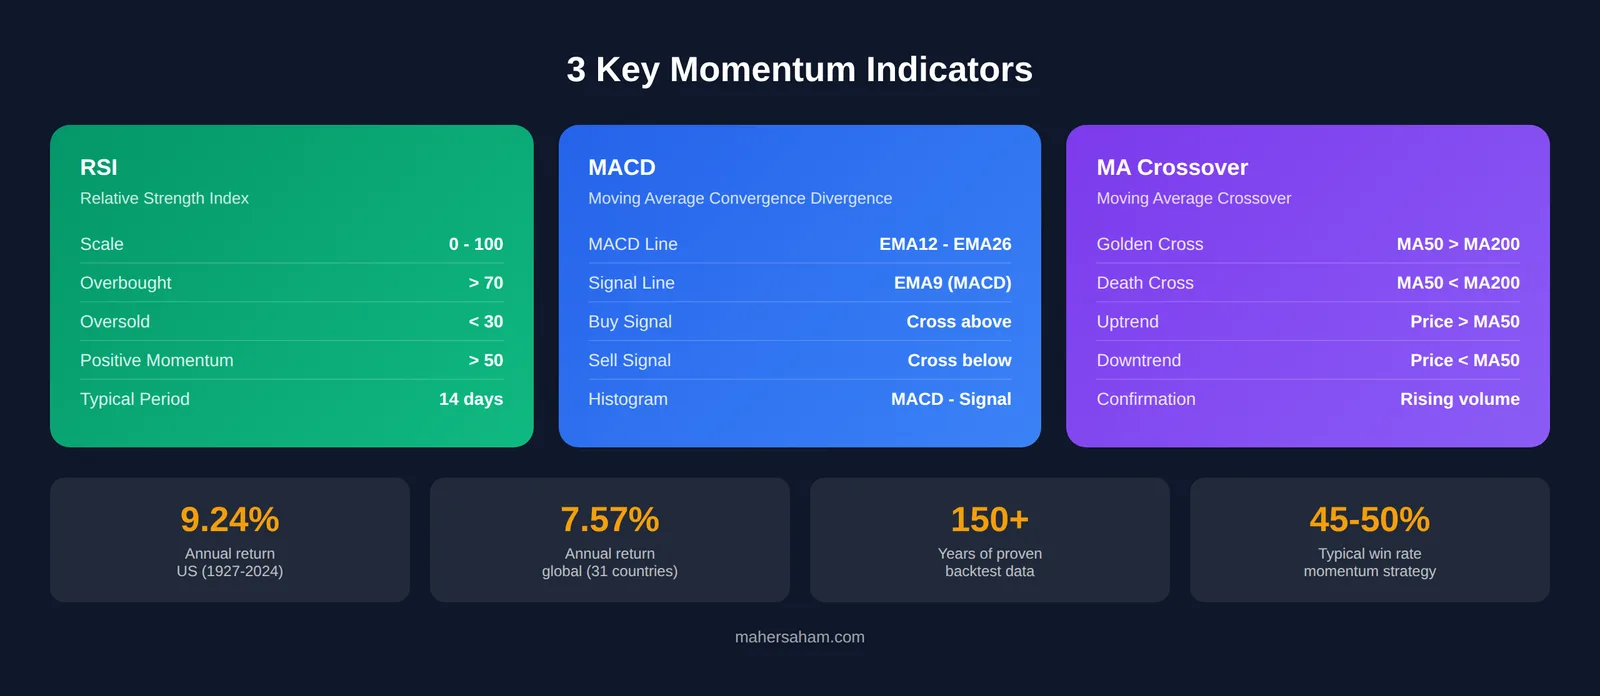
Global data spanning 150 years proves this strategy works. According to Quant Investing, a long-short momentum strategy generated an average return of 9.24% per year in US markets from 1927 to 2024, and 7.57% globally. It has proven effective across all 31 countries studied.
Why Does Momentum Work? The Science Behind Trends
Why do stocks that rise tend to keep rising? The answer lies in a combination of investor psychology and market mechanics:
1. Underreaction to Good News
When a company announces financial results that beat expectations, the stock price typically rises - but it doesn't immediately reflect the full value of the news. The market "digests" information gradually, creating opportunities for momentum investors to get in early.
2. Herding Behavior
When investors see a stock rising, more people follow and buy. This creates herding behavior - a chain reaction where price increases attract more buyers, which in turn pushes prices even higher.
3. Institutional Fund Flows
Large fund managers cannot buy or sell large quantities of stock in a single day without moving the price. They need several weeks or months to build a full position, creating sustained buying pressure that supports the upward trend.
4. Academic Evidence: Jegadeesh & Titman (1993)
The landmark study by Jegadeesh and Titman published in the Journal of Finance demonstrated that buying top-performing stocks from the past 3-12 months and selling bottom performers generated an average return of 1% per month. This is not a coincidence - it is a consistent phenomenon across decades and geographies.
5 Key Momentum Indicators Every Investor Should Know
To identify stocks with strong momentum, investors use several key technical indicators:
1. Relative Strength Index (RSI)
RSI measures the speed and magnitude of price movements on a scale of 0-100. A reading above 50 indicates positive momentum, while below 50 indicates negative momentum. According to Investing.com, RSI above 70 signals overbought conditions (potential pullback), while below 30 is oversold.
2. MACD (Moving Average Convergence Divergence)
MACD consists of two lines - the MACD Line (difference between EMA 12 and EMA 26) and the Signal Line (EMA 9 of the MACD Line). When the MACD Line crosses above the Signal Line, it gives a buy signal. Conversely, a downward cross is a sell signal. Read how to combine MACD with other indicators in our article on combining Fibonacci, MACD & Ichimoku.
3. Moving Average Crossover
When a short-term moving average (e.g., 50-day MA) crosses above a long-term moving average (e.g., 200-day MA), it is known as a "Golden Cross" - a strong bullish momentum signal. Conversely, a "Death Cross" occurs when the 50-day MA crosses below the 200-day MA.
4. Rate of Change (ROC)
ROC measures the percentage change in price over a specific period. For example, a 20-day ROC calculates how much the price has changed over the last 20 trading days. A rising positive reading indicates strengthening momentum.
5. Volume
Increasing trading volume accompanying price rises confirms momentum strength. If prices rise but volume declines, this is a warning that momentum may be weakening and the trend could potentially reverse.
How to Apply Momentum Strategy on Bursa Malaysia
Here are practical steps for Bursa Malaysia investors looking to apply momentum strategy:
Step 1: Screen Stocks Using Relative Momentum
List stocks that have recorded the highest price gains over the past 6-12 months. Focus on stocks with high liquidity (daily trading volume exceeding 1 million units) to ensure you can enter and exit easily.
Step 2: Confirm With Technical Indicators
After the initial screen, confirm momentum using RSI (above 50), MACD (bullish crossover), and increasing volume. Stocks that meet all three criteria have a higher probability of continuing the trend.
Step 3: Enter on Pullbacks
Don't chase prices at the peak. Wait for a small pullback (3-5% retracement) before entering. This gives you a better entry point and a more favorable risk-reward ratio.
Step 4: Set Stop Losses
Momentum can reverse quickly. Set a stop loss at 7-10% below the purchase price to limit losses. Read more about stop loss and position sizing to protect your capital.
Step 5: Use Trailing Stops to Lock in Profits
As the stock rises, raise your stop loss along with it (trailing stop). For example, if the stock rises 20% from purchase price, raise the stop loss to 10% above purchase price - this guarantees a minimum profit while still allowing room for further upside.
Momentum Stock Examples on Bursa Malaysia
Here are some examples of stocks that showed strong momentum on Bursa Malaysia at various times:
Semiconductor Stocks (2020-2021)
Malaysia's semiconductor sector became the best momentum example. Stocks like Inari Amertron, Frontken, MI Technovation, and ViTrox recorded gains of 200-500% within 18 months. Momentum was driven by the global chip shortage, rising 5G demand, and AI trends. Momentum investors who entered on Golden Cross signals reaped massive returns.
Press Metal (2016-2021)
Press Metal Aluminium is a long-term momentum example. From around RM1 in 2016 to over RM6 in 2021, this stock showed a consistent upward trend over 5 years - driven by rising aluminium prices and capacity expansion. Investors who followed this trend in stages enjoyed extraordinary returns.
Glove Stocks - Momentum That Ended Tragically
Glove stocks like Top Glove and Hartalega demonstrated extreme momentum during COVID. Prices rose 10-20 times within months. However, investors who entered late - after momentum had already weakened (RSI consistently above 80, volume declining) - suffered massive losses when the trend reversed. This illustrates the importance of exit discipline in momentum investing.
Sunway Berhad (2023-2026)
Sunway Berhad showed stable momentum driven by property development, infrastructure projects, and hospital expansion. Not as dramatic as semiconductor stocks, but steady and consistent - suitable for more conservative momentum investors.
Momentum vs Other Investment Strategies
How does momentum investing compare to other strategies?
| Aspect | Momentum | Contrarian | Value |
|---|---|---|---|
| Principle | Buy what's rising | Buy what's falling | Buy what's cheap |
| Trigger | Strong trend, breakout | Extreme panic | Low PE, undervalued |
| Holding period | 3-12 months | 1-3 years | 3-10+ years |
| Win rate | 45-50% | 55-65% | 60-70% |
| Strengths | High returns, clear trends | Cheap entry, margin of safety | Lower risk, dividends |
| Weaknesses | Whipsaw, sudden reversals | Requires high patience | Slow returns |
Some investors combine momentum and value - seeking stocks that are undervalued AND showing early momentum (value-momentum combo). This strategy is often considered the strongest as it combines margin of safety with trend confirmation. Read more: Growth vs Value Stocks.
5 Key Risks and Common Mistakes
Momentum strategy is not without risks. Here are the most common pitfalls:
1. Whipsaw - Sudden Reversals
Momentum can reverse in the blink of an eye, especially when there is shocking negative news, government policy changes, or massive selling by institutional investors. Without a stop loss, losses can spiral quickly.
2. Entering Too Late (Chasing)
The most common mistake is buying a stock after it has already risen too high. When RSI exceeds 80 and the price is far from the 50-day MA, pullback risk is very high. Disciplined momentum investors DO NOT chase prices - they wait for pullbacks.
3. Overtrading
Momentum investing involves more transactions compared to buy-and-hold. Each transaction has costs - broker commissions, spreads, and taxes (if applicable). According to Quantified Strategies, you should factor in a 30-40% drag from gross returns for transaction costs.
4. Overconfidence After Winning Streaks
Several consecutive wins can create overconfidence bias - investors begin increasing position sizes, ignoring stop losses, or entering trades without thorough analysis. This can wipe out months of profits in a single bad trade.
5. Momentum Crashes
In certain years (e.g., 2009, during the post-GFC recovery), momentum strategies suffered large losses when severely beaten-down stocks suddenly bounced ("junk rally") and momentum stocks failed to keep up. This is called a "momentum crash" and it occurs periodically.
Unique Characteristics of Momentum on Bursa Malaysia
Bursa Malaysia has several characteristics that affect momentum strategy:
Limited Liquidity
Compared to NYSE or Nasdaq, Bursa Malaysia has much lower liquidity. This means momentum can be excessive in small cap stocks due to the limited number of buyers and sellers. Focus on stocks within FBM KLCI or FBM70 for better liquidity.
Foreign Investor Influence
Foreign fund flows play a major role in Malaysian market momentum. When foreign investors enter in large volumes, KLCI30 stocks like Maybank and Tenaga Nasional can show strong momentum for weeks.
Cyclical Sectors
Sectors like semiconductors, construction, and oil & gas have clear cycles. Momentum in these sectors often connects with broader economic cycles - for example, Petronas Chemicals moves in tandem with global oil prices.
Frequently Asked Questions (FAQ)
What is momentum investing in simple terms?
Momentum investing means buying stocks that have shown a strong upward trend, with the expectation they will continue rising over the next 3-12 months. The principle: "trend is your friend" - follow the flow, don't fight it.
Is momentum investing the same as speculation or gambling?
No. Momentum investing is backed by over 150 years of academic data proving this phenomenon exists and is consistent. It is not random price guessing - it is based on trend analysis, volume, and technical indicators measured objectively.
How long does a typical momentum trade last?
Most momentum trades last between 3-12 months. Some investors use shorter periods (1-3 months), while others ride trends for a year or more. The optimal period depends on the strength of the trend and individual investment style.
What is the best indicator for momentum investing?
No single indicator is perfect. A combination of RSI (for momentum strength), MACD (for trend direction), and Moving Average Crossover (for trend confirmation) provides the most reliable signals. Volume is also critical as confirmation.
Is momentum investing suitable for beginners on Bursa Malaysia?
It can be practiced by beginners, but with caution. Start with KLCI30 stocks that have high liquidity, use tight stop losses (7-10%), and limit position size to 5-10% of portfolio. Do not apply it to penny stocks or small caps.
How does momentum investing differ from contrarian investing?
Momentum investing buys stocks that are rising (follows the trend), while contrarian investing buys stocks that are falling (fights the trend). Both can be profitable in the right context - momentum in trending markets, contrarian in markets that overreact.
What is the biggest risk of momentum investing?
The biggest risk is sudden reversals (whipsaw) where the trend reverses without warning. Without a stop loss, investors can lose months of profits in a single day. Exit strategy discipline is the key to survival with this strategy.
Can you combine momentum with value investing?
Yes, and it is often considered the strongest strategy. Look for stocks that are undervalued (low PE, price below intrinsic value) AND showing early momentum (RSI rising, MACD bullish crossover). This combination provides margin of safety with trend confirmation.
Conclusion
Momentum investing is a strategy proven effective over more than 150 years - data shows average returns of 9.24% per year in US markets and 7.57% globally. On Bursa Malaysia, semiconductor stocks, commodities, and blue chips receiving foreign fund flows are often the best momentum candidates. However, success requires strict discipline in risk management, especially stop losses and exit strategies.
To start applying momentum strategy on Bursa Malaysia, you need an efficient trading account.
Open a CDS M+ account to start investing on Bursa Malaysia and also international stocks such as US and Hong Kong markets through our CDS account registration page.
Download our free Stock Market Basics Ebook to understand the fundamentals of stock investing before applying momentum strategy.
Further Reading
- Contrarian Investing: The Art of Buying When Everyone Runs
- 3 Indicators, 1 System: How to Combine Fibonacci, MACD & Ichimoku
- Stop Loss & Position Sizing: How to Protect Your Capital
- Growth vs Value Stocks: When to Pick Which?
- Overconfidence Bias: Why Traders Who Win 3 Times Straight Start Losing Capital