Symbols and Colours in Trading Platforms
Beside the counter name or stock name displayed on your trading platform, you may sometimes notice unusual symbols. Failing to understand these symbols or colours could expose you to unnecessary risks.
Here are the symbols commonly found on trading platforms:
- = News/ Announcements
o = Shariah-compliant counters
! = PN17/ PN4/ GN3 counters, active with alert announcement
C = Cum Entitlements for the Company
X = Ex Entitlements for the Company
F = Frozen
R = Reserved
S = Suspended
These symbols are generally the same across most platforms because the software houses that develop the programmes for the various brokers are largely the same.
Trading Platform Software Suppliers Used by Brokers
On Bursa Malaysia, generally from the time I started as a remisier six years ago until now, I have only seen ExcelForce. N2N was also around back then, and I believe it is still operating today.
That said, new brokers have also emerged to compete for investors'' attention, such as Rakuten and Standard Chartered. With this competition, it is hoped that brokers in Malaysia will improve their services to provide optimal service to investors and traders.
Importance of Remembering Stock-Related Symbols
The first thing I always check is whether a counter is Shariah-compliant or not. Try to avoid counters with the C symbol if you do not intend to buy a counter that is about to distribute a dividend. If you are indeed a fan of dividend strategies, some counters with the C symbol will be distributing dividends in the near future. You can add them to your watchlist and conduct your own research.
Sometimes investors are surprised when shares they already hold in their portfolio suddenly change in units or experience a sharp price change. For this, check whether there is an X symbol beside the counter name. This indicates that the company has carried out a corporate exercise, where the company may have done a share split, bonus issue, dividend distribution, share consolidation, or rights issue.
If you wish to buy shares to benefit from corporate exercises as mentioned above, you need to purchase them before the counter name displays the X symbol.
Counters with the ! symbol are companies that have issues with Bursa Requirements, and are categorised as either PN17 or GN3.
Colours in Trading Platforms
Regarding the colours used in trading platforms, refer to the image below which I took from https://thekapital.my/fahami-simbol-simbol-dan-warna-berbeza-yang-ada-di-platform-trading/
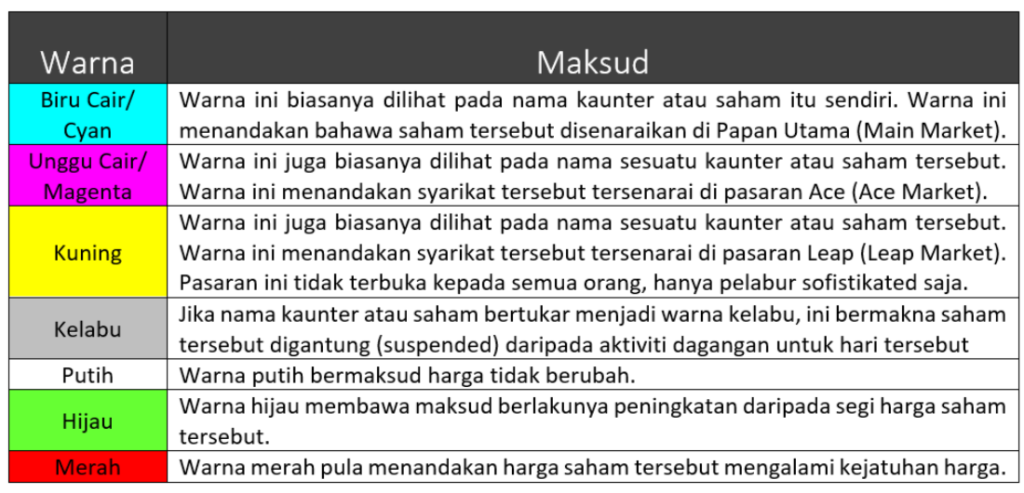
That is a brief explanation of the colours used. Below is an example as seen within the platform:
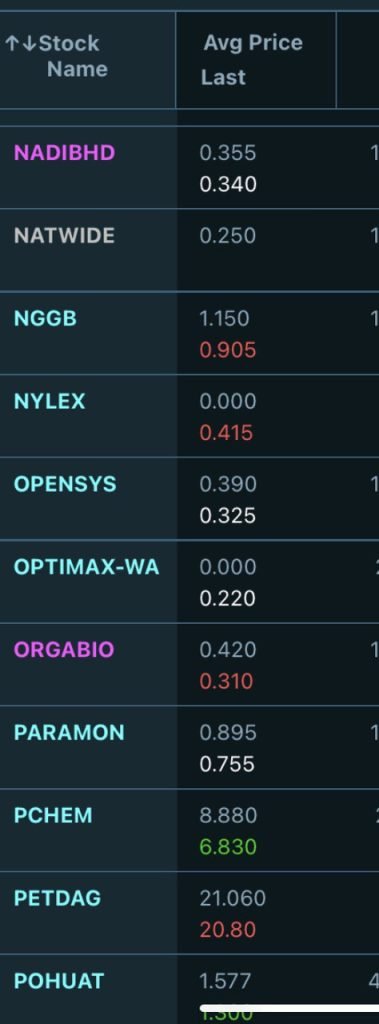
NADIBHD and ORGABIO are stocks listed on the ACE Market, whilst PETDAG and PCHEM are stocks on the Main Market.
As you can see, PCHEM''s Last price is in green, meaning it is higher than yesterday''s closing price, whilst white indicates no change, and red means the price is lower than yesterday''s closing price.
Transaction Colours
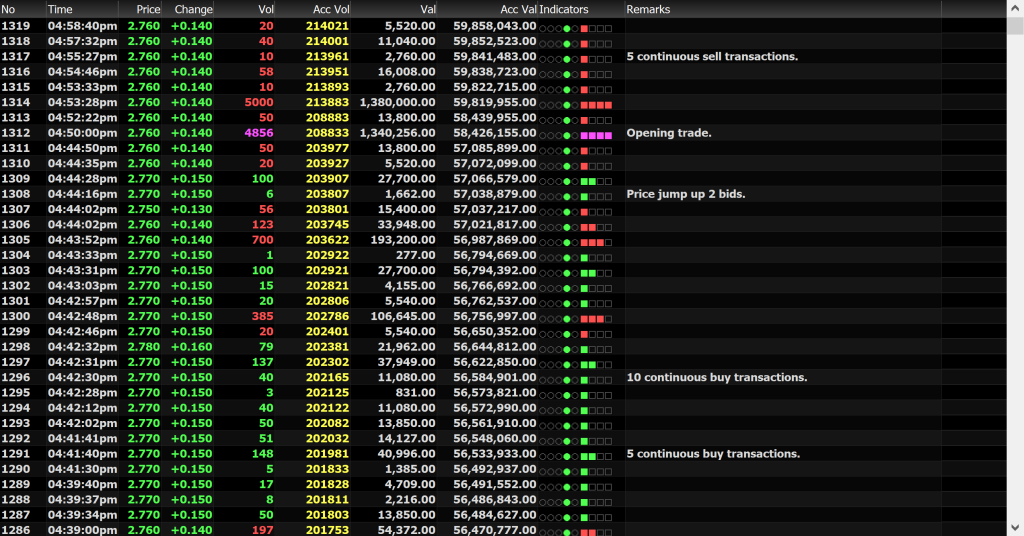
Above is an example of transactions displayed on the Mplus PC platform. Another name for this view is time and sales.
Each row refers to a transaction that took place, showing how many lots were sold and bought, and at what price.
The green colour in the ''Vol'' column indicates the number of lots transacted as Buy Up. If it is red, it represents a Sell Down. To understand what Buy Up and Sell Down mean, refer to the article Market Depth Cara Mudah Faham.
The purple colour in the ''Vol'' column typically appears at 9am, 2.30pm, and 4.50pm. These are the times when the system begins auto-matching orders that were placed or accumulated before the market opens, after the market break, and before the market closes to determine the closing price at 4.50pm. Refer to the article Beli Saham Sebelum Pukul 450 Petang.
For the ''Price'' column, green indicates the price is higher than the previous day''s closing price, white means it is the same as the closing price, and red means it is lower than the previous day''s closing price.
Frequently Asked Questions (FAQ)
1. What do the symbols on a trading platform mean?
Symbols on a trading platform refer to special markers beside stock counter names that provide important information such as Shariah compliance status, UMA alerts, or trading suspensions. Understanding these symbols is crucial so that investors are not exposed to risks they are unaware of.
2. What do green and red colours mean on a trading platform?
Green typically indicates a price increase or Buy Up, whilst red indicates a price decrease or Sell Down. These colours help investors read market movements more quickly.
3. What does the purple colour in the volume column mean?
The purple colour usually appears at specific times such as 9am, 2.30pm, and 4.50pm. It indicates the system is performing auto-matching for orders accumulated before the trading session opens, during the break, or before the market closes.
4. Where can I learn the basics of stocks in greater depth?
You can download the free Mahersaham ebook to learn the fundamentals of stock investing. If you do not yet have a trading account, you can also open a CDS account with Mahersaham to start investing.
Conclusion
Understanding the symbols and colours on a trading platform is an essential foundational step for every investor. Without this knowledge, you may make high-risk investment decisions. Take your first step today!
If you are serious about learning stocks, open a CDS account with Mahersaham and download our free ebook as a beginner''s guide.