How to Read a Bursa Malaysia Annual Report Without Getting a Headache

Annual Report (AR) is the most important document for stock investors. Every Bursa Malaysia listed company MUST publish an AR each year within 4 months of financial year-end, per Bursa Listing Requirements. But here's the problem for retail investors: a typical AR is 200-400 pages, full of technical jargon, numerical tables, and formal language that gives you a headache.
The reality: you DON'T need to read every page. Professional investors who read 50+ ARs a year know exactly which sections matter and which can be skipped. They also know the most efficient reading order to extract maximum insight in 30-60 minutes.
In this article, we walk through step-by-step how to read Bursa Malaysia AR: 1. What is an Annual Report and how it differs from Quarterly Report 2. How to find and download AR from Bursa Malaysia or the company website 3. 8 main sections with a speed-reading strategy for each 4. Best reading order for retail investors 5. Red flags you must watch for in an AR 6. Tools and platforms to shortcut your analysis
For deeper understanding of each section, we'll link to the dedicated Cara Baca Annual Report series (Part 1 to Part 7).
What Is an Annual Report?
Annual Report is the official document published by listed companies once a year, containing: - Annual financial statements (audited) - Management narrative on company performance - Corporate governance information (board of directors, shareholding structure) - Outlook and strategy going forward
Unlike Quarterly Report which focuses only on the latest financial numbers, AR gives a complete picture of strategy, risks, and company position for the full year.
When Is the AR Published?
Per Bursa Malaysia Listing Requirements: - Main Market companies: maximum 4 months after year-end - ACE Market companies: maximum 5 months after year-end - Annual General Meeting (AGM): within 6 months after year-end
For companies with 31 December year-end, ARs typically come out March-April the following year.
Step 1: Find and Download the Annual Report
There are three easy ways to obtain a Bursa Malaysia company's AR:
Method 1: Bursa Malaysia Official Website
- Visit Bursa Malaysia Announcements
- Select the company from the "Select Company" dropdown
- Choose "Annual Reports" category
- Click "Submit"
- Download the latest AR PDF
Method 2: Company Website (Investor Relations)
Every listed company has an Investor Relations (IR) page:
- Maybank: maybank.com/investor-relations
- Tenaga: tenaga.com.my/investor-relations
- Public Bank: publicbank.com.my/investor-relations
There's usually an "Annual Report" or "Reports & Presentations" section with ARs for the last 5-10 years.
Method 3: Aggregator (Faster)
For accessing multiple ARs simultaneously: - MalaysiaStock.Biz - directory of all listed company ARs - i3investor - integrated with stock data - KLSE Screener - includes ARs + corporate announcements
Tip: Download ARs for the last 5 years at once. You'll need them to track year-over-year trends - not just one year.
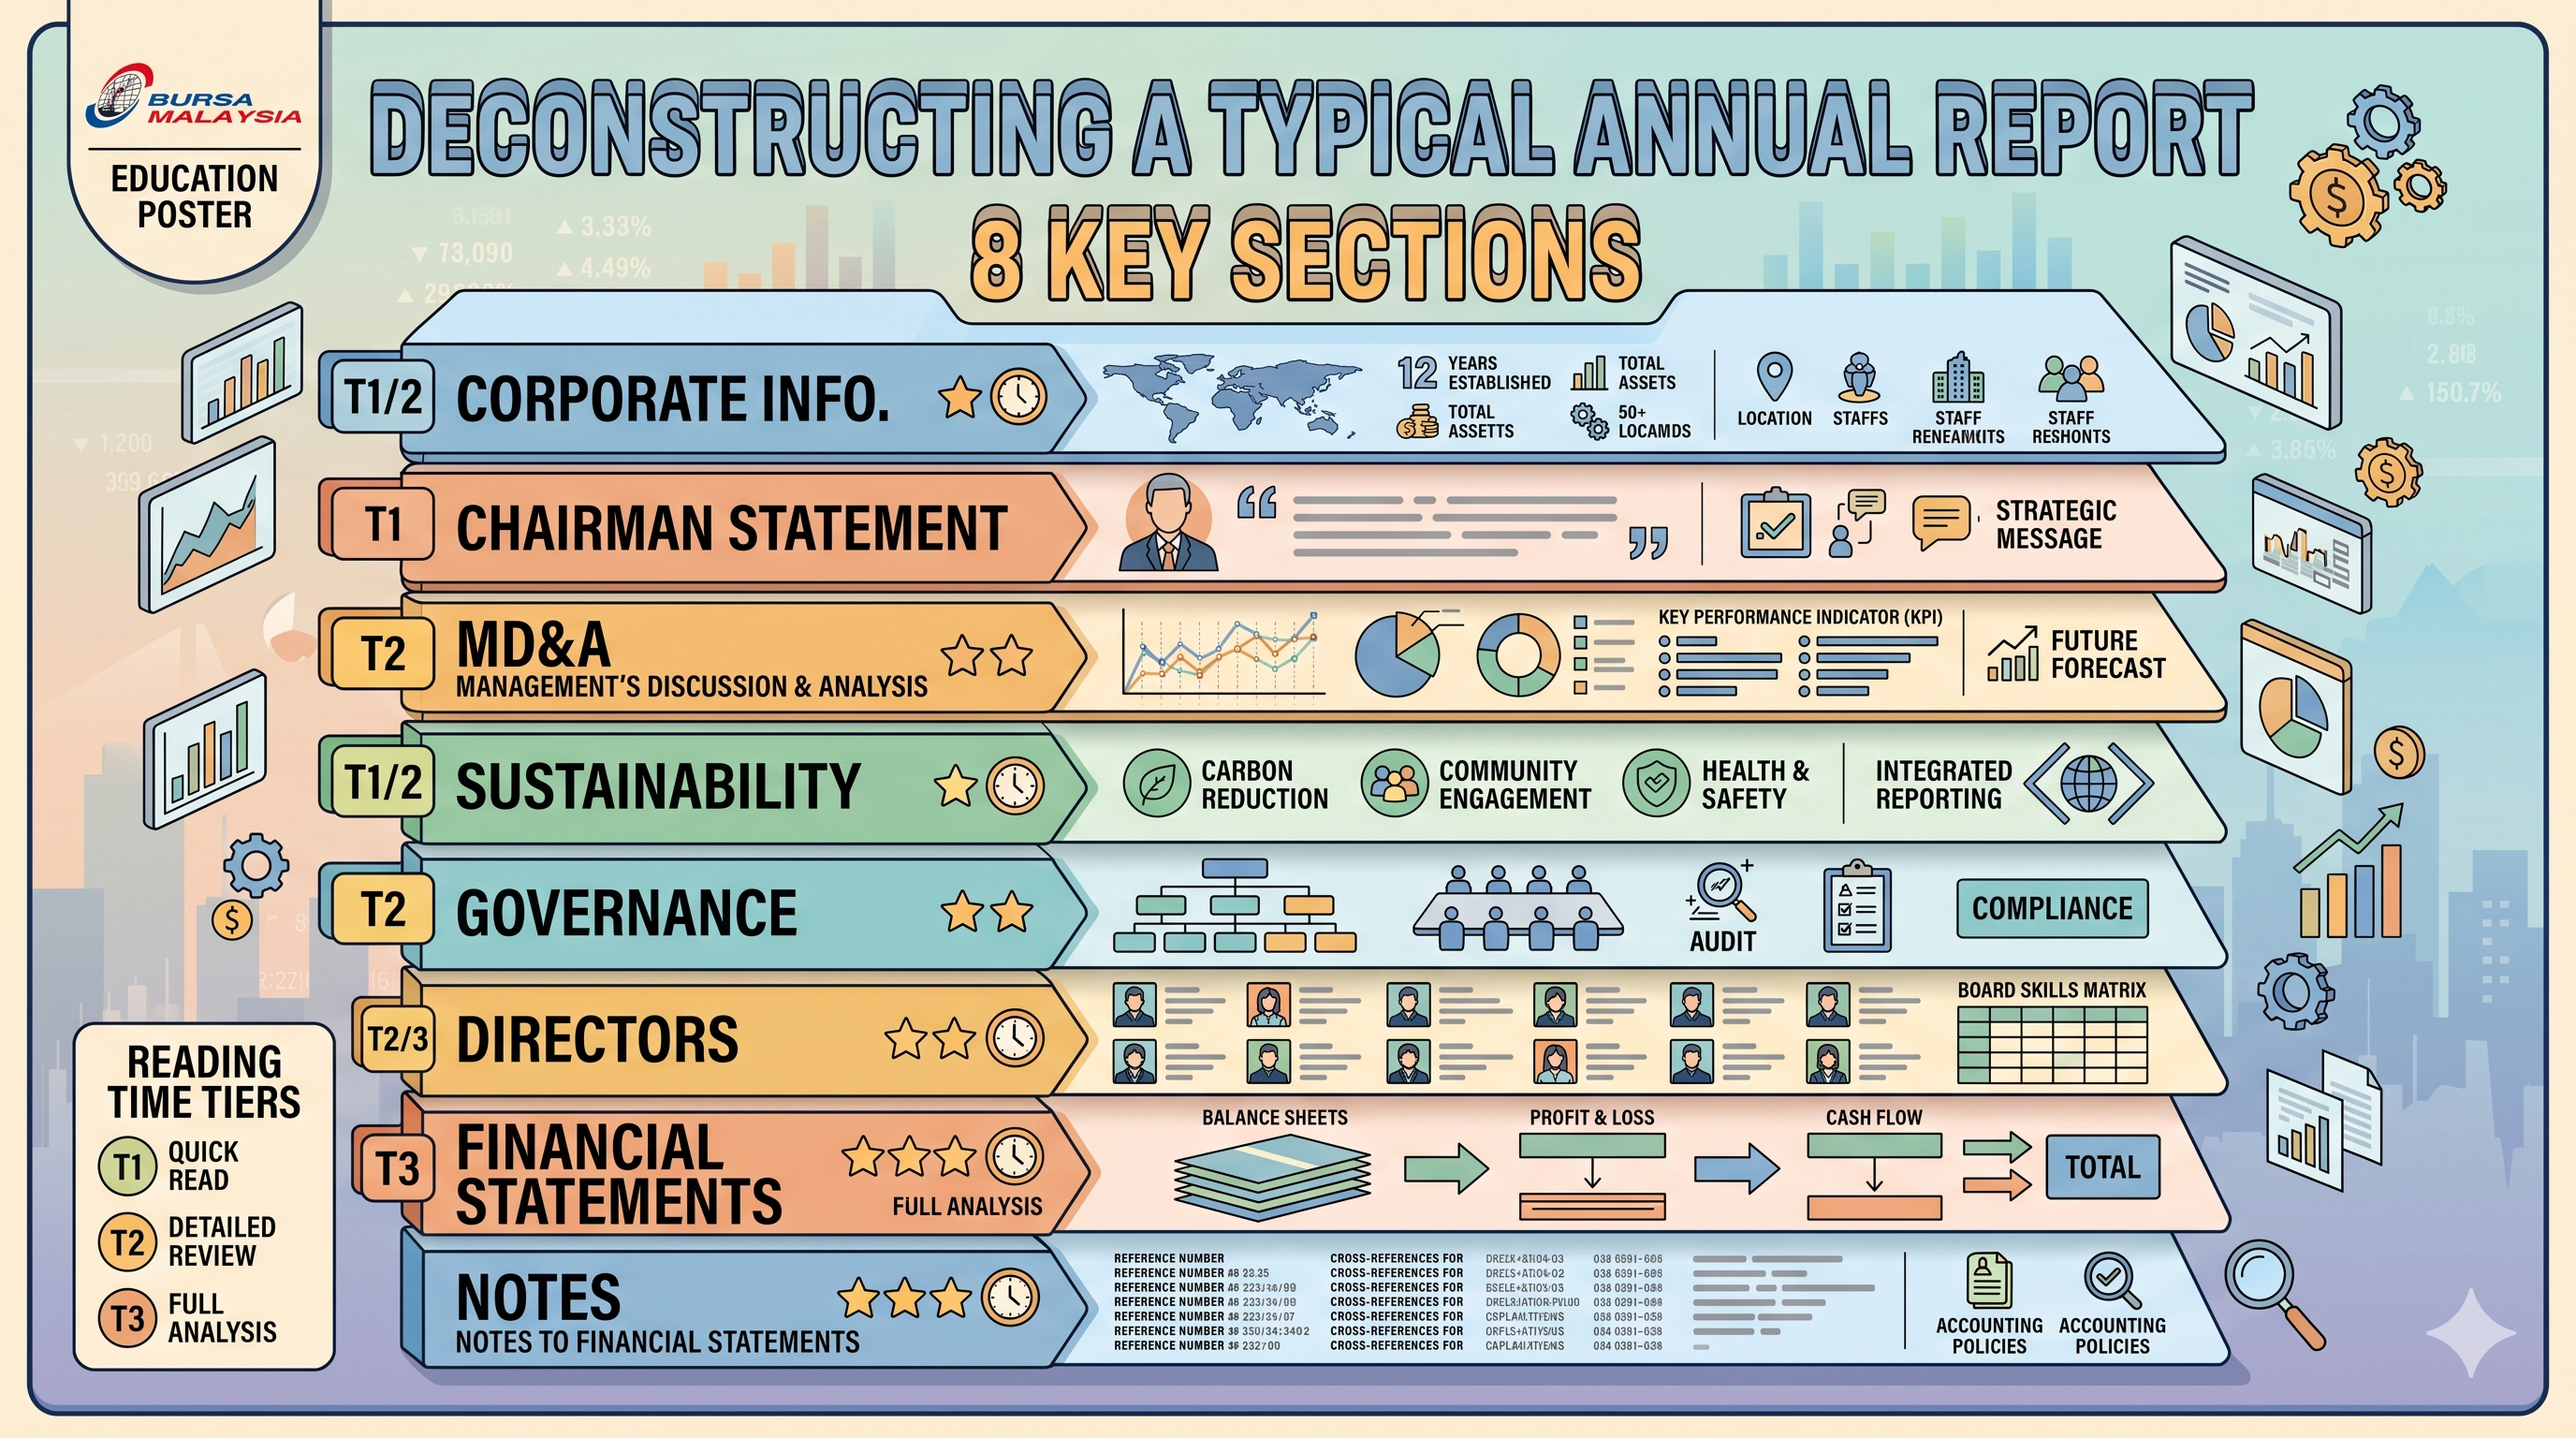
Anatomy of the Annual Report: 8 Main Sections
While each AR has its own style, the basic structure is usually 8 sections. Complete breakdown:
1. Corporate Information & Profile
The first section, usually 5-15 pages, containing: - Vision, mission, company values - Business and geographic operations - Brief history & milestones - Subsidiaries & associates
Speed-reading strategy: Just skim to understand what the company does and where they operate. Long-term investors can skip this.
For deeper understanding of corporate structure (subsidiaries, ownership), read Cara Baca Annual Report Part 3 - Corporate Structure.
2. Chairman's Statement & CEO's Message
This section is the most overrated by new investors. It usually contains: - Chairman praising company performance - Industry trend and economic commentary - Promises for the future
Speed-reading strategy: Read the introduction (1-2 paragraphs) to get the tone. Skip the rest unless you find management being critical of problems - that's a signal of honest management.
Red flag: If the Chairman/CEO is always positive and never acknowledges problems, be suspicious. Real companies always have challenges - management that doesn't acknowledge them isn't handling problems proactively.
3. Management Discussion & Analysis (MD&A)
THIS IS THE MOST IMPORTANT SECTION in the AR. MD&A is a mandatory disclosure for Bursa-listed companies since FY2016, containing:
- Performance review by division/segment
- Explanation of revenue & profit trends
- Strategy and key initiatives
- Risk factors & mitigations
- Outlook for the coming year
Speed-reading strategy (15-20 minutes): 1. Read the financial highlights summary first - get the helicopter view 2. Focus on declining segments - what does management say about causes and recovery plans? 3. Look for explanations of margin compression or expansion - critical for forecasting 4. Read the outlook section - what does management expect for next year? 5. Note capital allocation plans - will it grow organically, M&A, or return cash?
For deep MD&A reading techniques, refer to Annual Report Part 4: Management Discussion & Analysis and Management Discussion & Analysis: Pengurusan Sembang Apa Di Sebalik Nombor?.
4. Sustainability Report & ESG
A mandatory section for listed companies since Bursa Malaysia Sustainability Reporting Guide: - Climate-related disclosures (TCFD) - Material ESG topics & KPIs - Community & employee initiatives
Speed-reading strategy: Skip unless you explicitly care about ESG, or the company is in a high-ESG-risk sector (palm oil, mining, oil & gas).
For Muslim investors: this section can hint at company business practices - but refer to the SC Malaysia Shariah-Compliant list as the primary authority.
5. Corporate Governance Statement
5-15 pages about: - Board of Directors structure - Independence ratio - Audit Committee, Nomination Committee, Remuneration Committee - Risk Management & Internal Control
Speed-reading strategy (5-10 minutes): 1. Check independence ratio - target ≥50% independent directors for Main Market 2. Note Chairman vs CEO - same person? (red flag if yes for large companies) 3. See board attendance rate - <80% is weak governance 4. Check board diversity - gender, age, expertise
For detailed guidance, read Cara Baca Annual Report Part 6: Corporate Governance and Annual Report Part 7: Peranan Committee.
6. Information on Directors & Key Management
A section often skipped by retail investors but must be read: - Profile of each director (background, positions in other companies) - Director and management shareholdings - Remuneration packages
Speed-reading strategy (10 minutes): 1. Skill match: does board background fit the business? (e.g., tech company needs tech-savvy directors) 2. Insider shareholdings: what percentage do directors own? Higher is better (skin in the game) 3. Cross-directorships: how many other boards does the director sit on? >5 = red flag (lack of focus) 4. Compensation ratio: CEO pay vs employee median - >100x consider scrutiny
For techniques on picking companies based on director quality, refer to Cara Baca Annual Report Part 5: Information On Directors.
7. Financial Statements (The Hardest)
The most intimidating section for new investors but richest in information. Comprises 4 main statements:
A. Income Statement (Statement of Profit or Loss)
Shows revenue, costs, and profit over the year: - Revenue (sales) - Cost of Sales (COGS) - Gross Profit = Revenue - COGS - Operating Expenses - Operating Profit (EBIT) - Interest Expense - Tax - Net Profit
Key metrics to track: Revenue growth, Gross Margin, Operating Margin, Net Margin.
B. Balance Sheet (Statement of Financial Position)
Snapshot of assets, liabilities, equity at year-end: - Current assets (cash, receivables, inventory) - Non-current assets (PPE, intangibles, investments) - Current liabilities (payables, short-term debt) - Non-current liabilities (long-term debt, lease liability) - Shareholders' equity
Key ratios: Current Ratio, Debt-to-Equity, Net Debt / EBITDA.
C. Cash Flow Statement
Important because net profit can be manipulated but cash can't. Three sections: - Operating Cash Flow (OCF) - from core operations - Investing Cash Flow - capex, M&A, asset sales - Financing Cash Flow - borrowings, dividends, buybacks
Key metric: Free Cash Flow = OCF - Capex. This is real cash available for dividends or growth.
D. Statement of Changes in Equity
Tracks shareholders' equity movement throughout the year. Important for seeing: - Dividends paid - New shares issued (dilution) - Share buyback - Retained earnings growth
Speed-reading strategy (30-45 minutes, this takes the longest): 1. Start with Income Statement - compare 3-year YoY 2. Move to Balance Sheet - check leverage trends 3. Go to Cash Flow - confirm cash matches profit (if diverging, red flag) 4. Look at Notes to Financial Statements for important details (segment data, related party transactions, contingent liabilities)
8. Notes to Financial Statements
The "details" section for number-crunchers. Usually contains: - Segment reporting (revenue by business division) - Geographic breakdown - Related party transactions - Contingent liabilities - Stock options & ESOS
Speed-reading strategy: DON'T read everything. Be selective: 1. Segment reporting - which segment is most profitable? 2. Related party transactions - red flag if large (potential governance issue) 3. Contingent liabilities - litigation, guarantees that could impact future financials
Efficient Reading Order (For Retail Investors)
Based on professional investor analysis of thousands of ARs, the best reading order is:
Tier 1: Must Read (60-90 minutes)
- Financial Highlights (1-2 pages at front) - 5 minutes
- Full MD&A - 20-30 minutes
- Income Statement + 3-year comparison - 10 minutes
- Balance Sheet + key ratios - 10 minutes
- Cash Flow Statement - 10 minutes
Tier 2: Should Read (30 minutes)
- Segment Reporting in Notes - 10 minutes
- Directors profile & shareholdings - 10 minutes
- Outlook / forward statements in MD&A - 5 minutes
- Significant accounting policy changes - 5 minutes
Tier 3: Can Skip (unless specific concern)
- Chairman/CEO message (if no bold critique)
- Sustainability Report (unless ESG-focused investor)
- Corporate Governance (unless governance concern)
- Marketing fluff (event photos, awards)
Total time: 60-90 minutes for efficient read, 3-4 hours for comprehensive read.
Red Flags You Must Watch For
While reading the AR, watch for these warning signs:
Red Flag #1: Auditor's Report Different from Standard
The audit firm (usually Big 4 - PwC, KPMG, EY, Deloitte) issues an auditor's opinion. Standard opinion = "True and Fair View". If there's: - Qualified opinion - certain concerns - Going concern emphasis - company may not survive 12 months - Adverse opinion - financial statements unreliable - Disclaimer of opinion - auditor can't form a view
Any of these is a major red flag - investigate deeply.
Red Flag #2: Frequent Auditor Changes
If the company changes audit firms often (>1x in 5 years), there's potential governance issue. Big 4 changes = more okay. Tier-2 firm changes = possibly a trap.
Red Flag #3: High Profit but Weak Cash Flow
Compare Net Profit with Operating Cash Flow: - Net Profit > OCF for 2-3 consecutive years: weak earnings quality - Maybe the company records revenue but doesn't receive actual cash - Or aggressive accounting policies
Red Flag #4: Large Related Party Transactions
Transactions with related parties (directors, major shareholders, unlisted subsidiaries) that are significant: - >5% of revenue: warning - >10% of revenue: serious red flag - Recurring: potentially extracting value from minority shareholders
Red Flag #5: Trade Receivables Growing Faster Than Revenue
If receivables grow >50% but revenue only grows 10%: - Customers not paying on time - Maybe the company is extending credit terms to pump revenue - Risk of write-offs ahead
Red Flag #6: Off-Balance Sheet Items
Look in the Notes: - Operating leases (now mandatory on-balance sheet since MFRS 16, but check old ARs) - Contingent liabilities (litigation, guarantees) - Subsidiary not consolidated
These items can fail to appear in the Balance Sheet but impact actual financials.
Red Flag #7: Frequent Capital Raising
Track funding sources over 5 years: - Repeated rights issues, private placements, bond issuances = cash burn - Healthy companies generate cash internally - Dilutive raising = value reduction for existing shareholders
Tools & Shortcuts for AR Analysis
You don't need to calculate everything manually. The following platforms have pre-calculated important ratios:
Platforms for Quick Analysis:
- i3investor - free, AR + financial ratios
- ShareInvestor - subscription, full historical data
- Bursa Marketplace - free, includes Bursa Academy education modules
- KLSE Screener - free, comprehensive
- Stockbit - free + paid tier
Suggested Workflow:
- Initial screen: i3investor / KLSE Screener for top-level numbers
- Deep dive: download ARs for shortlisted companies
- Calculation verification: own Excel template to reproduce ratios
- Industry comparison: compare with 3-5 peers in same sector
How to Read AR as a Beginner
If you're a first-time investor trying to read an AR for the first time, here's a more realistic approach:
Months 1-2: Familiarization
- Pick 1 company with an easy-to-understand business (e.g., Nestle, Heineken, PetGas)
- Download 3 years of ARs (latest 3)
- Spend 2-3 hours per AR with slow reading + dictionary
Months 3-4: Cross-Comparison
- Pick 3 companies in the same sector
- Compare financial ratios, MD&A narrative, governance
- Build a feel for what 'good' looks like
Month 5+: Systematic Process
- Develop your personal checklist (use this list as a starting point)
- Track 5-10 watchlist companies consistently
- Each time a new AR comes out, review in 1-2 hours
Realistic goal: After 6-12 months of practice, you can assess basic quality from an AR in <90 minutes.
FAQ: Common Questions
1. Is an Annual Report the same as a Quarterly Report?
No. AR is the annual report with audited financial statements + comprehensive narratives. QR is the quarterly report with unaudited numbers + minimal narrative. AR is more comprehensive but released later (4 months after year-end vs 2 months for QR).
2. Are ARs free to download?
Yes, all ARs are free and available at Bursa Malaysia, company websites, or aggregators like i3investor. AR is a public document required to be published.
3. How long should I spend reading 1 AR?
For beginners: 3-5 hours. For investors with 1-2 years of experience: 1.5-2 hours. For professionals: 30-90 minutes for efficient reads, 2-3 hours for comprehensive analysis.
4. I don't understand numbers - can I skip the financial statements?
Not recommended. Financial statements are the core of an AR - without reading them, you can't validate what management claims in the MD&A. Learn the basics of the 4 statements first - see Belajar Mengkaji Annual Report Dengan Pantas.
5. What's the difference between Audited and Unaudited?
Audited = financial statements that have been reviewed by an independent audit firm. More credible. Unaudited = preliminary numbers (usually quarterly results). ARs are always audited. Audited numbers can differ from unaudited quarterly results if there are year-end adjustments.
6. What language are Annual Reports in - BM or English?
Bursa Malaysia ARs can be published in English only, or bilingual (Bahasa Malaysia + English). Most large companies are bilingual. The audit opinion is usually in English.
7. Which AR is easiest for a beginner?
Try companies with a simple business model: - Nestle Malaysia - consumer goods, easy to understand - Petronas Gas - utility, predictable - Public Bank - traditional bank, but complex (skip when beginner)
Avoid: Conglomerates (Genting), holding companies (Sime Darby Plantation), or companies with complex structure (former Air Asia Group).
8. I've read the AR, what's the next step?
- Build a watchlist - 10-20 companies you understand
- Track new ARs annually for your watchlist
- Compare with peers in the same sector
- Subscribe to the mahersaham newsletter for financial updates
- Practice with a paper portfolio before committing real money
Conclusion
The Bursa Malaysia Annual Report is indeed long and looks complex, but with an efficient reading order and focus on important sections (MD&A + Financial Statements + Director Info), you can extract 80% of the value in just 60-90 minutes. Skip the fluff sections (marketing pages, repetitive sustainability), read financial statements carefully, and always cross-reference with 3-5 years of data to identify real trends.
Before making any investment decisions, ensure you have an active trading account and access to the annual reports of your watchlist companies.
To start investing in Bursa Malaysia and overseas markets like the US and Hong Kong, you need a CDS account - register your CDS account with Mahersaham here.
For stock investing fundamentals including how to read financial statements in detail, get our free stock investing fundamentals ebook.
Further Reading
Full Cara Baca Annual Report series for deep understanding of each section:
- Cara Baca Annual Report Syarikat - Part 1 - Basic AR introduction
- Cara Baca Annual Report Part 2: Corporate Exercise - Rights issue, bonus issue, share split
- Cara Baca Annual Report Part 3: Corporate Structure - Subsidiaries and corporate structure
- Annual Report Part 4: Management Discussion & Analysis - How to read MD&A
- Cara Baca Annual Report Part 5: Information On Directors - Board of directors analysis
- Cara Baca Annual Report Part 6: Corporate Governance - Corporate governance
- Annual Report Part 7: Peranan Committee - Audit, Nomination, Remuneration Committee
- Belajar Mengkaji Annual Report Dengan Pantas - Quick analysis technique
- ROE vs ROA vs ROIC: 3 Real KPIs Expert Investors Track - Quality metrics for company selection
- EV/EBITDA: The Valuation Metric for High-Debt Companies - Valuation for leveraged companies